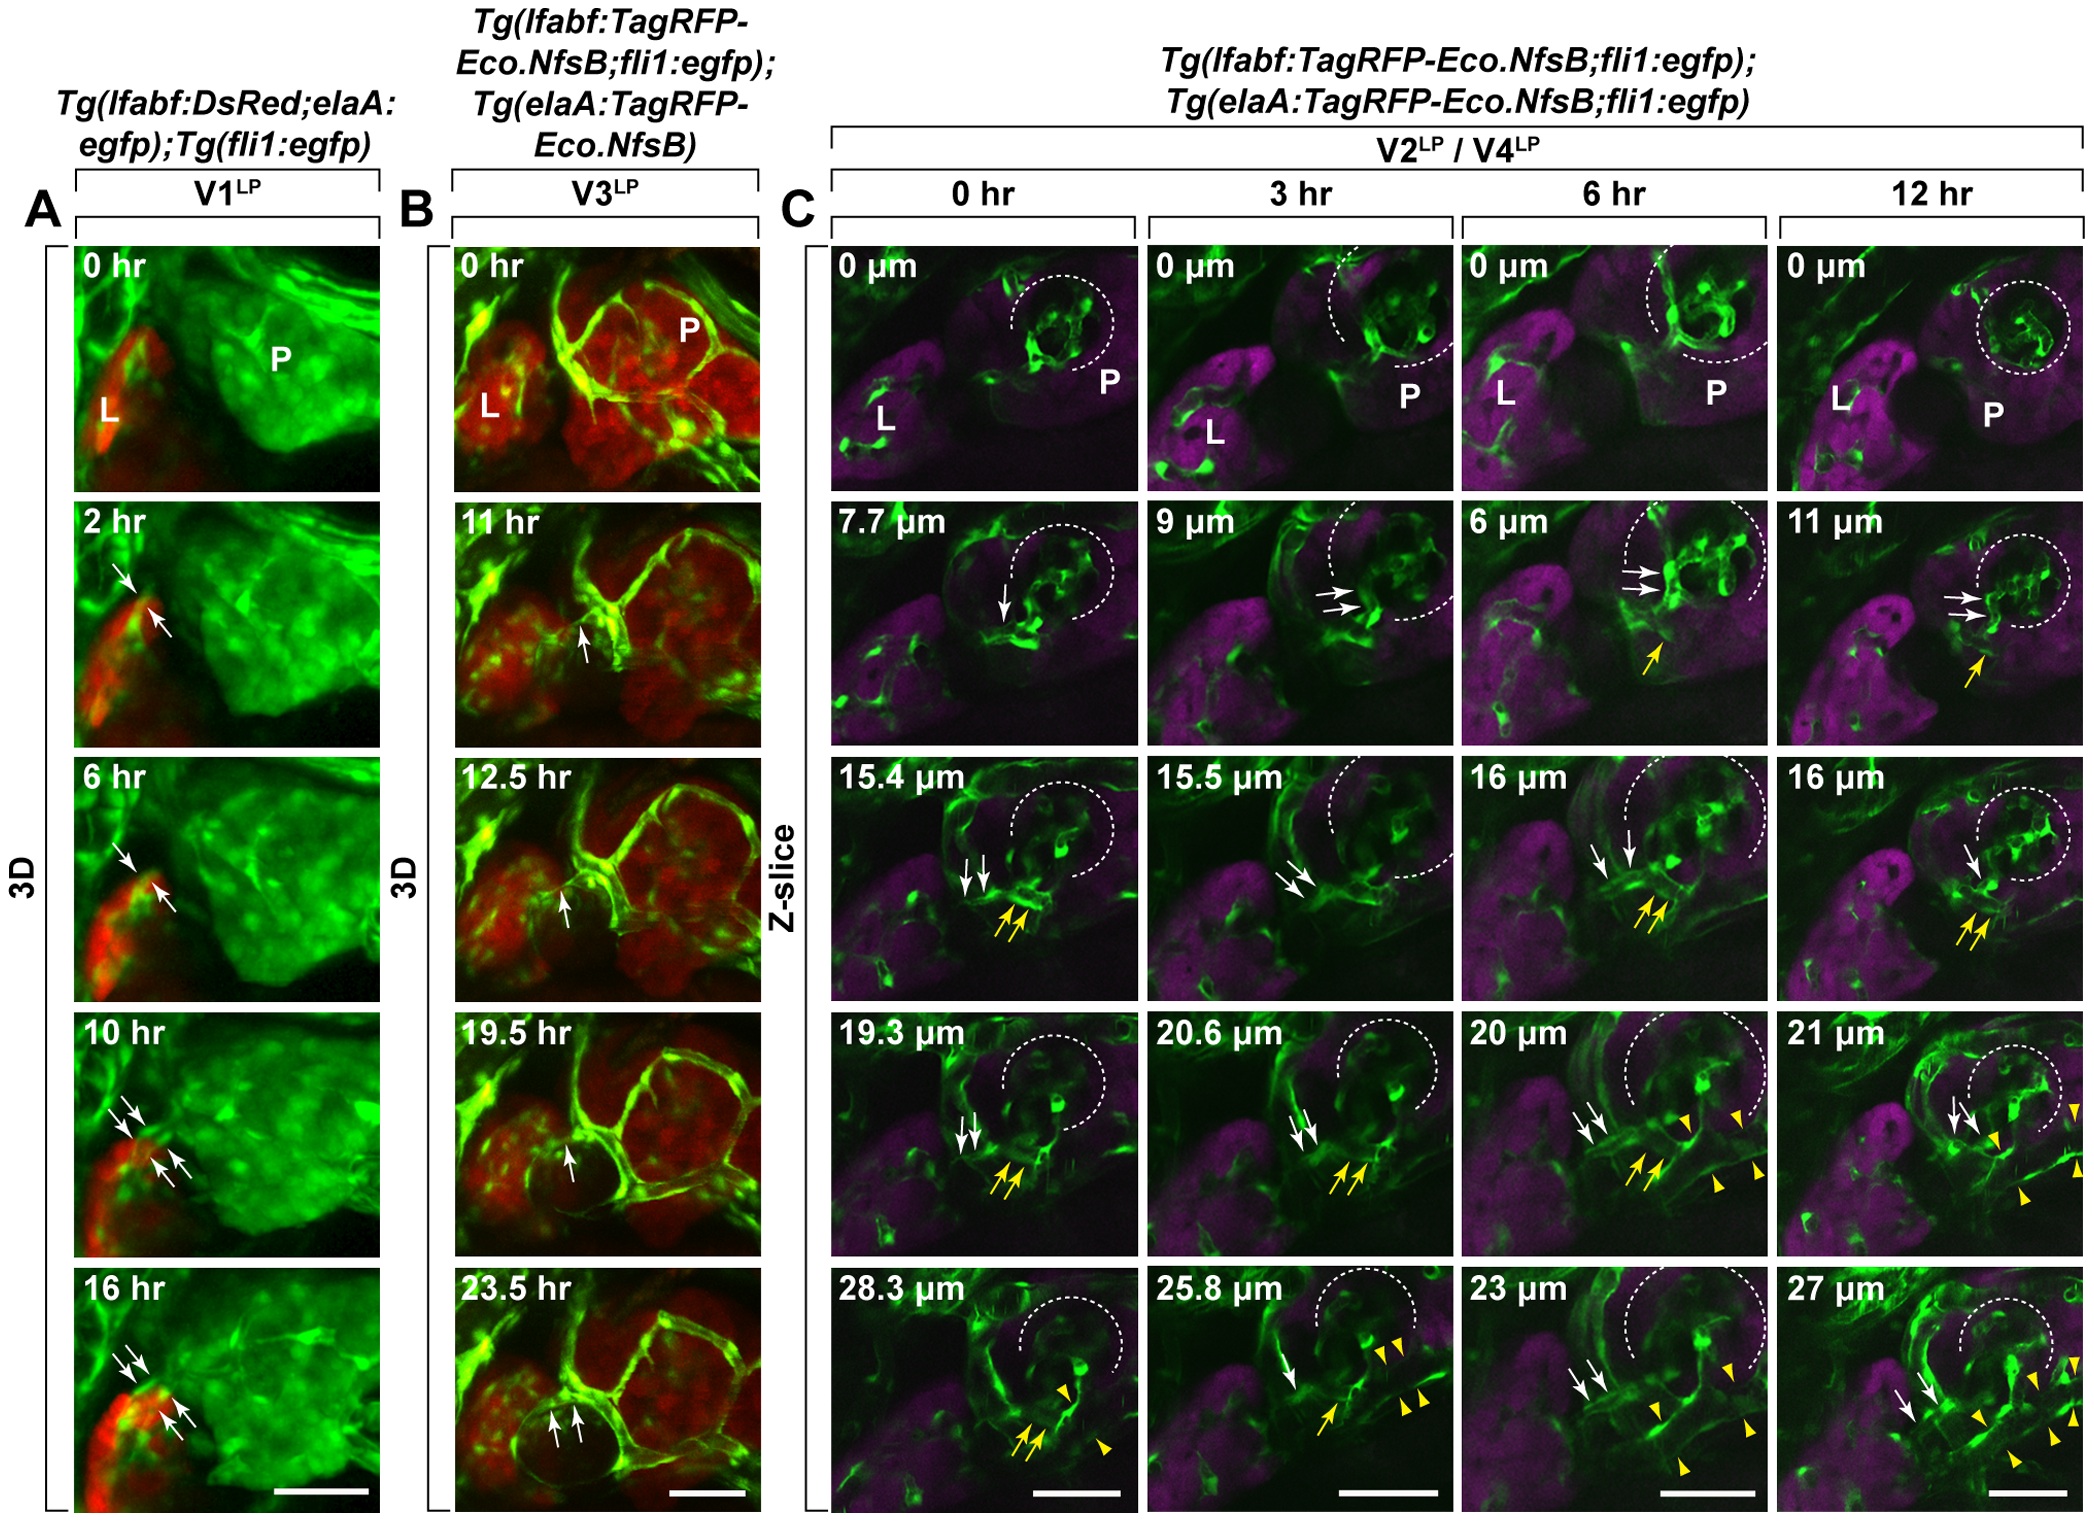
Fig. 5
Dynamics of the formation of V1LP and V3LP vessels.
The dynamic behavior of growing V1LP, V3LP, V2LP/V4LP inter-organ vessels were analyzed by time-lapse confocal microscopy using Tg(lfabf:DsRed;elaA:egfp);Tg(fli1:egfp) (A) and Tg(lfabf:TagRFP-Eco.nfsB;fli1:egfp);Tg(e laA:TagRFP-Eco.nfsB) (B) larvae, respectively. A. Panels show images from right side of larva with dorsal up, and the images were captured beginning at about 4?4.5 dpf. The V1LP vessel (EGFP: green) on the dorsal side (sandwhiched between white arrows) grows out of liver (DsRed: orange) and invades into pancreas (EGFP: green). B. Panels show images from right side of larva with dorsal up, and the images were captured beginning at about 4.5 dpf. The V3LP vessel (EGFP: green) on the dorsal side (white arrows) grows out of pancreas (TagRFP: orange) and invades into liver (TagRFP: orange). Time (h) elapsed since the beginning of the sequence is indicated at the top right in each panel. C. Panels show images from right side of larva with dorsal up, and the images were captured beginning at about 4 dpf. The embryo was observed at 0 hr, 3rd hr, 6th hr and 12th hr. V2LP vessel (white arrows) branches off from the vascular plexus in Islet of Langerhans of pancreas was observed at 0 hr, but it connects with hepatic vascular network by 12th hr. V4LP vessel (yellow arrows and sandwiched between yellow arrowheads) that is linking between V2LP (white arrows) and SIV(sandwiched between yellow arrowhead) was also observed. L: Liver, P: Pancreas. Scale bars: A, B: 40 μm; C: 30 μm.

