
|
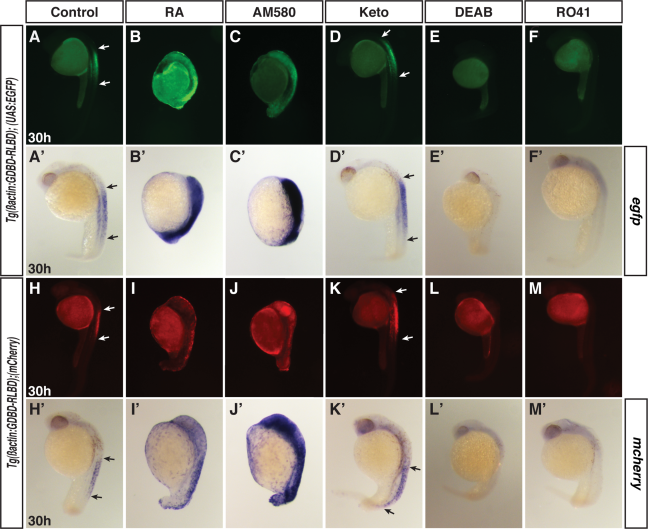
Fig. 4
RA sensor lines are responsive to RAR agonists and antagonists. A, A2, H, H2: Control untreated embryos. B, B2, C, C2, I, I2, J, J2: RA- or AM580-treated embryos show almost ubiquitous expression of the reporter. Embryos treated with RA or AM580 were posteriorized as a consequence of treatment with these agents. D, D2, K, K2: Keto caused an expansion of reporter expression. E, E2, F, F2, L, L2, M, M2: DEAB or RO41 treatment inhibited expression. None of the DEAB-treated (0 of 17) or R041-treated (0 of 17) Tg(β-actin:GDBD-RLBD);(UAS:EGFP) embryos had expression compared to 28% (17 of 61) sibling embryos, which is close to the 25% of expected fluorescent embryos used from an intercross of Tg(β-actin:GDBD-RLBD) and Tg(UAS:EGFP) hemizygous individuals. None of DEAB-treated (0 of 15) or R041-treated (0 of 14) Tg(β-actin:GDBD-RLBD);(UAS:mCherry) embryos had expression compared to 34% (18 of 53) sibling embryos, which is close to the 37.5% of expected fluorescent embryos used from an intercross of Tg(β-actin:GDBD-RLBD);(UAS:mCherry) hemizygous and (UAS:mCherry) hemizygous individuals. A?F and H?M are fluorescent images of live embryos. A2?F2 and H2?M2 are ISH. Arrows in A,A2,D,D2,H,H2,K,K2 indicate the length of the domain of reporter expression. All views are lateral with anterior up.