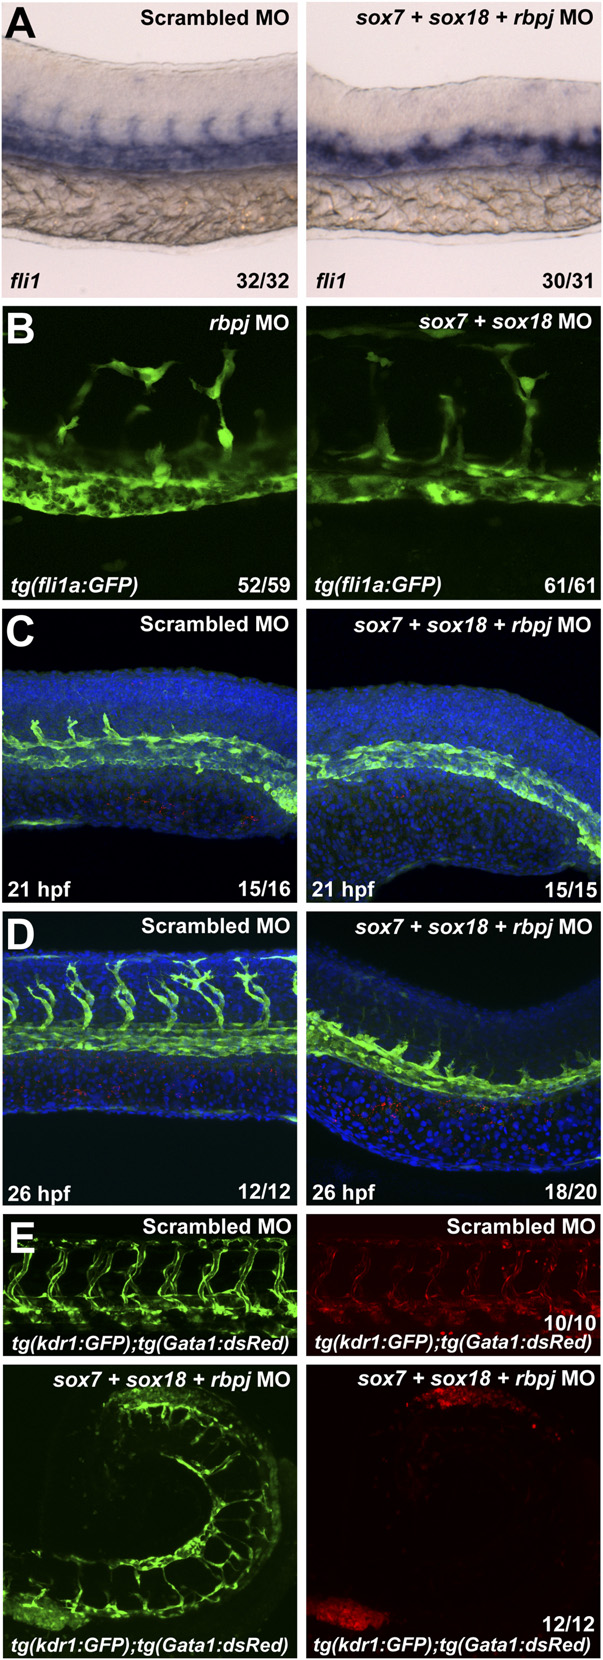
Fig. S7
(A) Whole-mount in situ hybridization against fli1a in 26 hpf WT zebrafish embryos after injection of control (Left) and triple sox7;sox81;rbpj MO (Right). Values on the bottom right indicate number of embryos with the predominant and displayed phenotype per total number of embryos. (B) Analysis of GFP expression in 26 hpf tg(fli1a:GFP) zebrafish embryos after rbpj and sox7;sox18 MO injection. Values on the bottom right indicate number of embryos with the predominant and displayed phenotype per total number of embryos. (C and D) Whole-mount double immunofluorescence against activated caspase- 3 (red) and GFP on tg(fli1a:GFP) zebrafish embryos after control (Left) and triple sox7;sox18;rbpj MO (Right) injection at 21 hpf (C) and 26 hpf (D). Nuclei were counterstained with DAPI. No significant apoptosis was detected. Values on the bottom right indicate number of embryos with the predominant and displayed phenotype per total number of embryos. (E) Analysis of GFP expression in 2.5-dpf tg(kdrl:GFP);tg(gata1:dsRed) zebrafish embryos after control and sox7;sox18;rbpj MO injection. Pooled blood cells could be detected in the trunk and tail of the sox7;sox18;rbpj MO-injected fish. Values on the bottom right indicate number of embryos with the predominant and displayed phenotype per total number of embryos. In all cases, 0.125 pmol of sox7 and sox18 and 0.15 pmol of rbpj MO were used.

