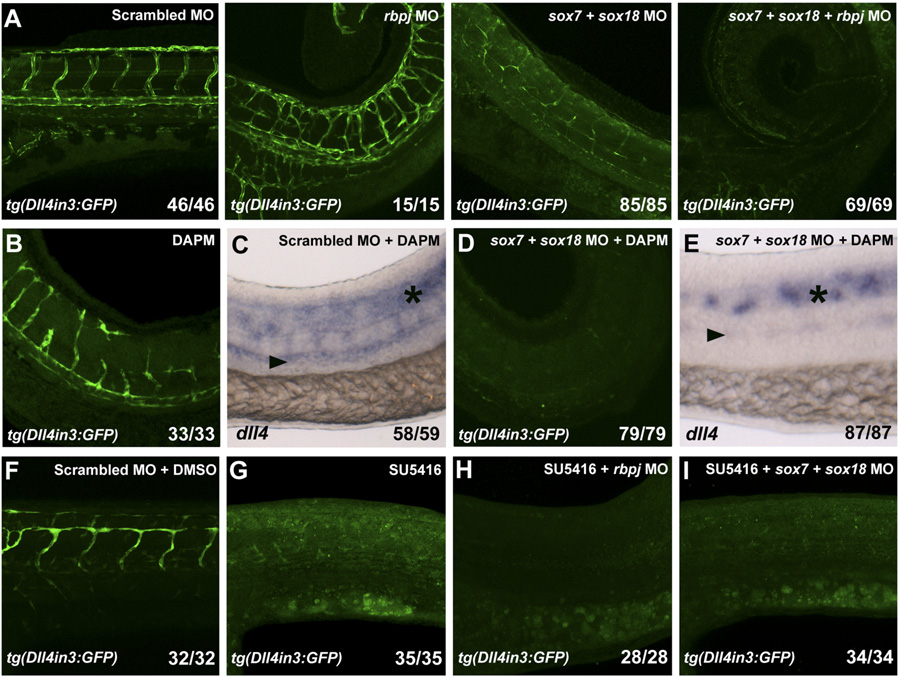
Fig. S6
(A) Analysis of GFP expression in 3-dpf tg(Dll4in3:GFP) zebrafish embryos after scrambled, rbpj, double sox7;sox18, and triple sox7;sox18;rbpj MO injections. Triple sox7;sox18;rbpj MO results in total ablation of tg(Dll4in3:GFP) expression. We used 0.25 pmol for sox7 and sox18 and 0.30 pmol of rbpj MO. (B–E) Analysis of GFP and endogenous dll4 expression in tg(Dll4in3:GFP) (34 hpf) and WT zebrafish (26 hpf) after chemical inhibition of Notch signaling with 100 μM N-[N-3,5-Difluorophenacetyl]-L-alanyl-S-phenylglycine Methyl Ester (DAPM) alone (B and C) and in combination with sox7;sox18 MO (D and E). sox7; sox18 MO injection in combination with DAPM results in total ablation of both GFP and endogenous dll4 expression. (F–I) Chemical inhibition of VEGF signaling in tg(Dll4in3:GFP) zebrafish embryos with 1 μM SU5416 alone or in combination with rbpj or double sox7;sox18 MO abolishes the GFP expression. Values on the bottom right indicate number of embryos with the predominant and displayed phenotype/ total number of embryos analyzed. In all cases, 0.125 pmol of sox7 and sox18 and 0.15 pmol of rbpj MO were used.

