
|
Fig. 1
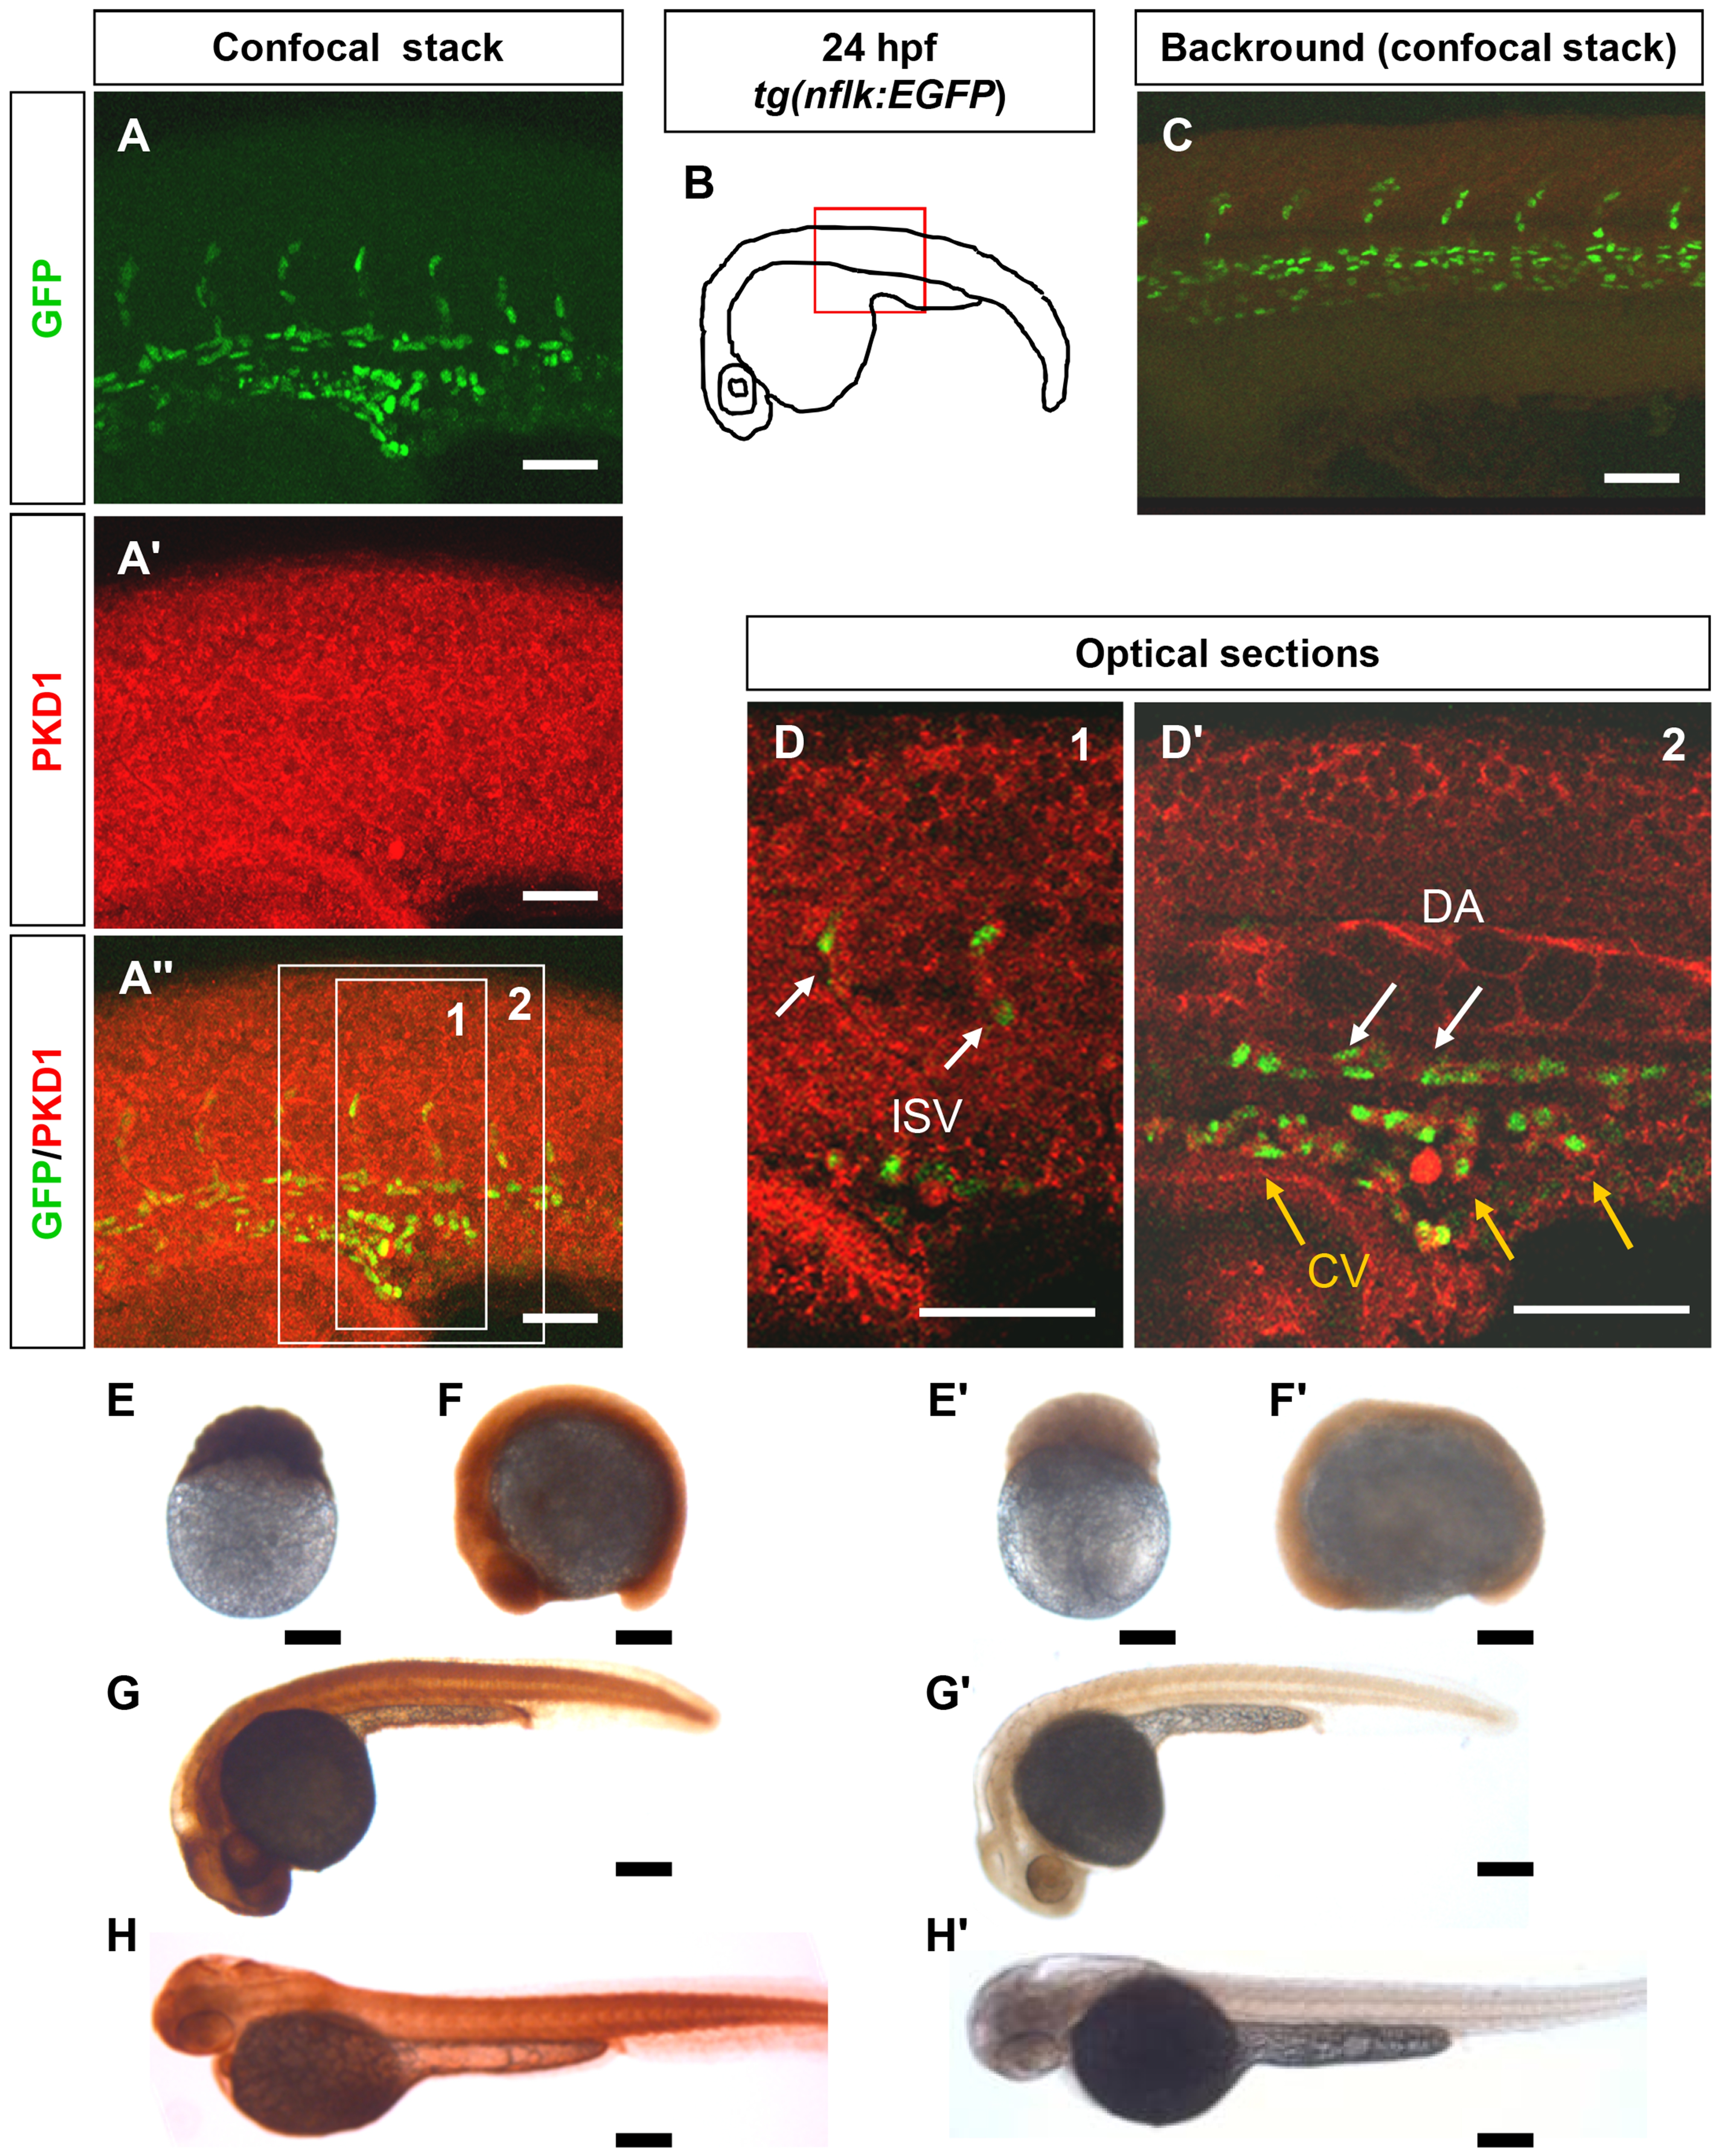
PKD1 expression in 24 hpf tg(nflk:EGFP) zebrafish embryo and in zebrafish development.
A?A3, Whole mount antibody staining for PKD1 in 24 hpf tg(nflk:EGFP) zebrafish embryos. Pictures show whole confocal stacks of several optical sections. GFP signal is shown in green (A), PKD1 staining in red (A2), (A3) displays the merge. Box 1 and 2 mark the area where single optical sections were selected from (D, D2). B, Scheme of a 24 hpf embryo. The red box marks the area of confocal images in (A). C, for background control, embryo was stained without antibody against PKD1. D, Optical sections of the embryo, where colocalization of nuclear GFP signal in endothelial cells (green) and PKD1 expression (red) is shown. ISV: intersomitic vessel. DA: dorsal aorta. CV: cardinal vein. E?H2, Expression of PKD1 during zebrafish embryogenesis indicated ubiquitous distribution of the PKD1 protein at the 256-cell stage, 14-somite stage, 24 hpf and 48 hpf as shown by whole mount PKD1 antibody staining (E?H). E2?H2, Whole mount antibody control stainings lacking the primary PKD1 antibody. White scale bars: 100 μm; black scale bars: 300 μm.