
Image
|
Figure Caption
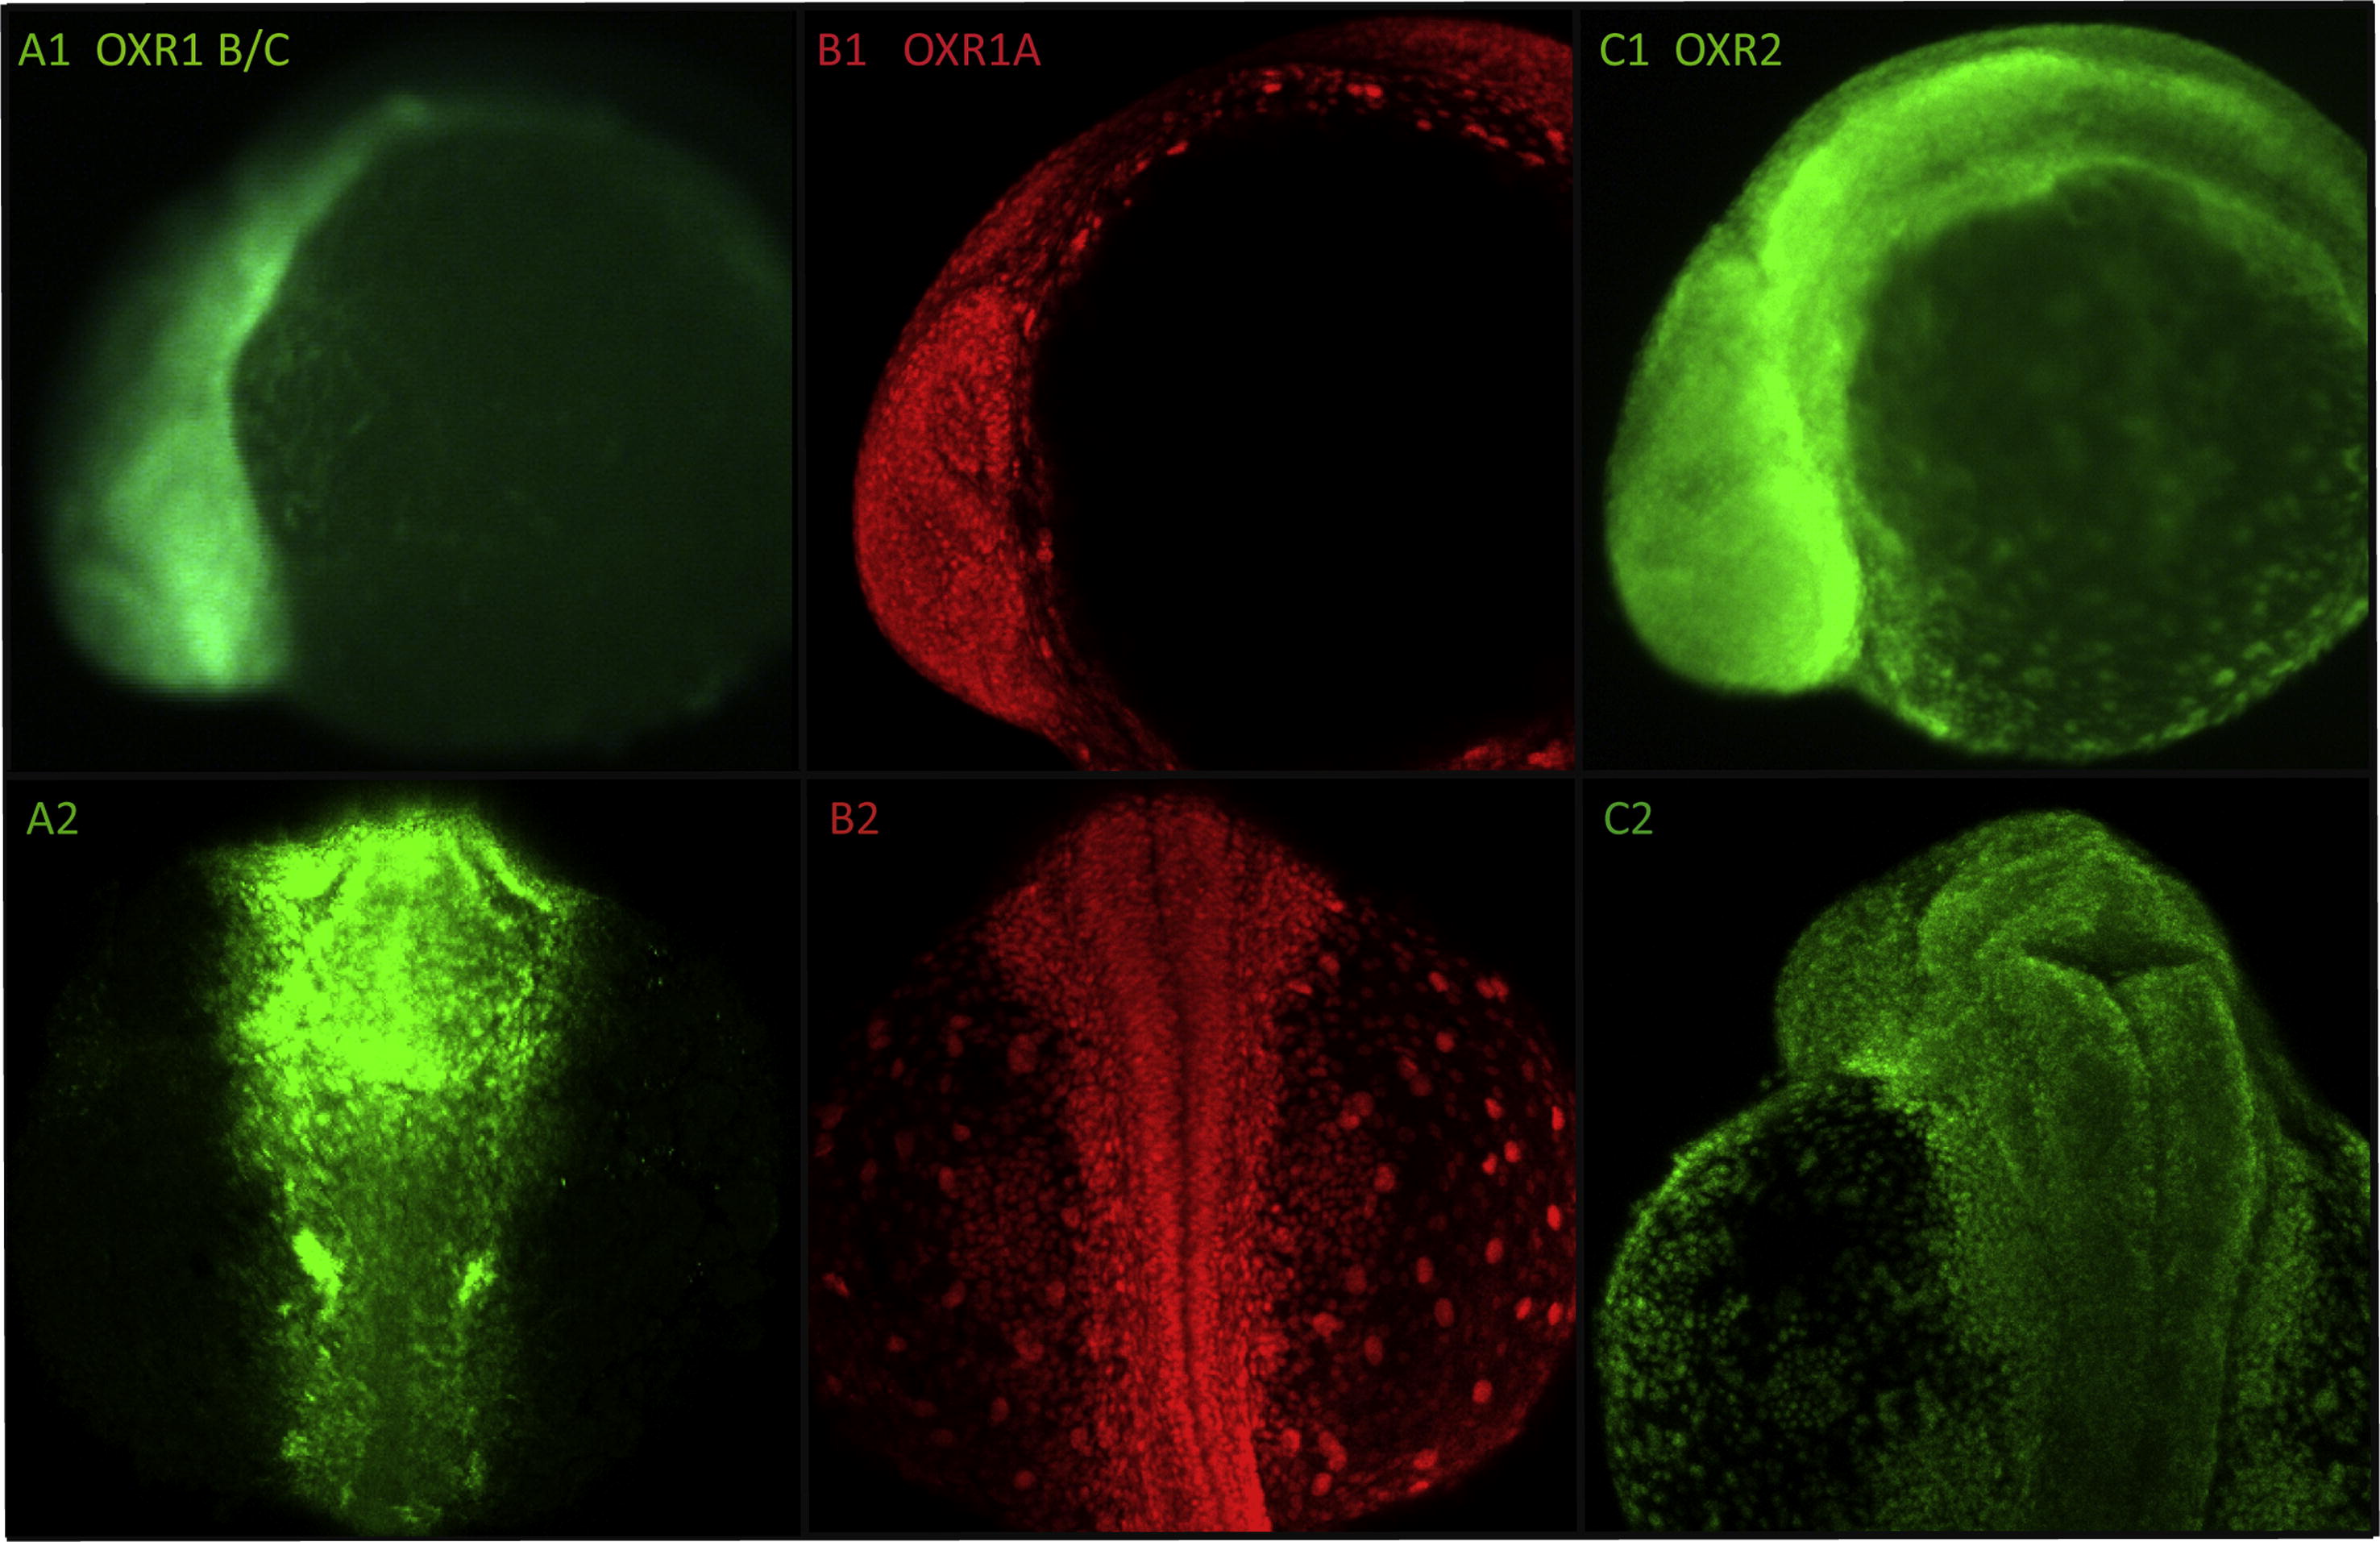
Fig. 4 Expression patterns of OXR genes with FISH in 24 hpf zebrafish embryos. The images are maximum intensity projections from confocal z-series of OXR1B/C (fluorescein green, in A1, A2), OXR1A (Cy3 red in B1, B2) and OXR2 (fluorescein green, in C1, C2). The embryos (A1, B1, C1) are orientated with the anterior to the left and the embryos (A2, B2, C2) are orientated with the anterior to the top and shown in dorsal view.
Figure Data
Acknowledgments
This image is the copyrighted work of the attributed author or publisher, and
ZFIN has permission only to display this image to its users.
Additional permissions should be obtained from the applicable author or publisher of the image.
Reprinted from Gene expression patterns : GEP, 13(7), Laroche, F.J., Tulotta, C., Lamers, G.E., Meijer, A.H., Yang, P., Verbeek, F.J., Blaise, M., Stougaard, J., and Spaink, H.P., The embryonic expression patterns of zebrafish genes encoding LysM-domains, 212-24, Copyright (2013) with permission from Elsevier. Full text @ Gene Expr. Patterns