Image
Figure Caption
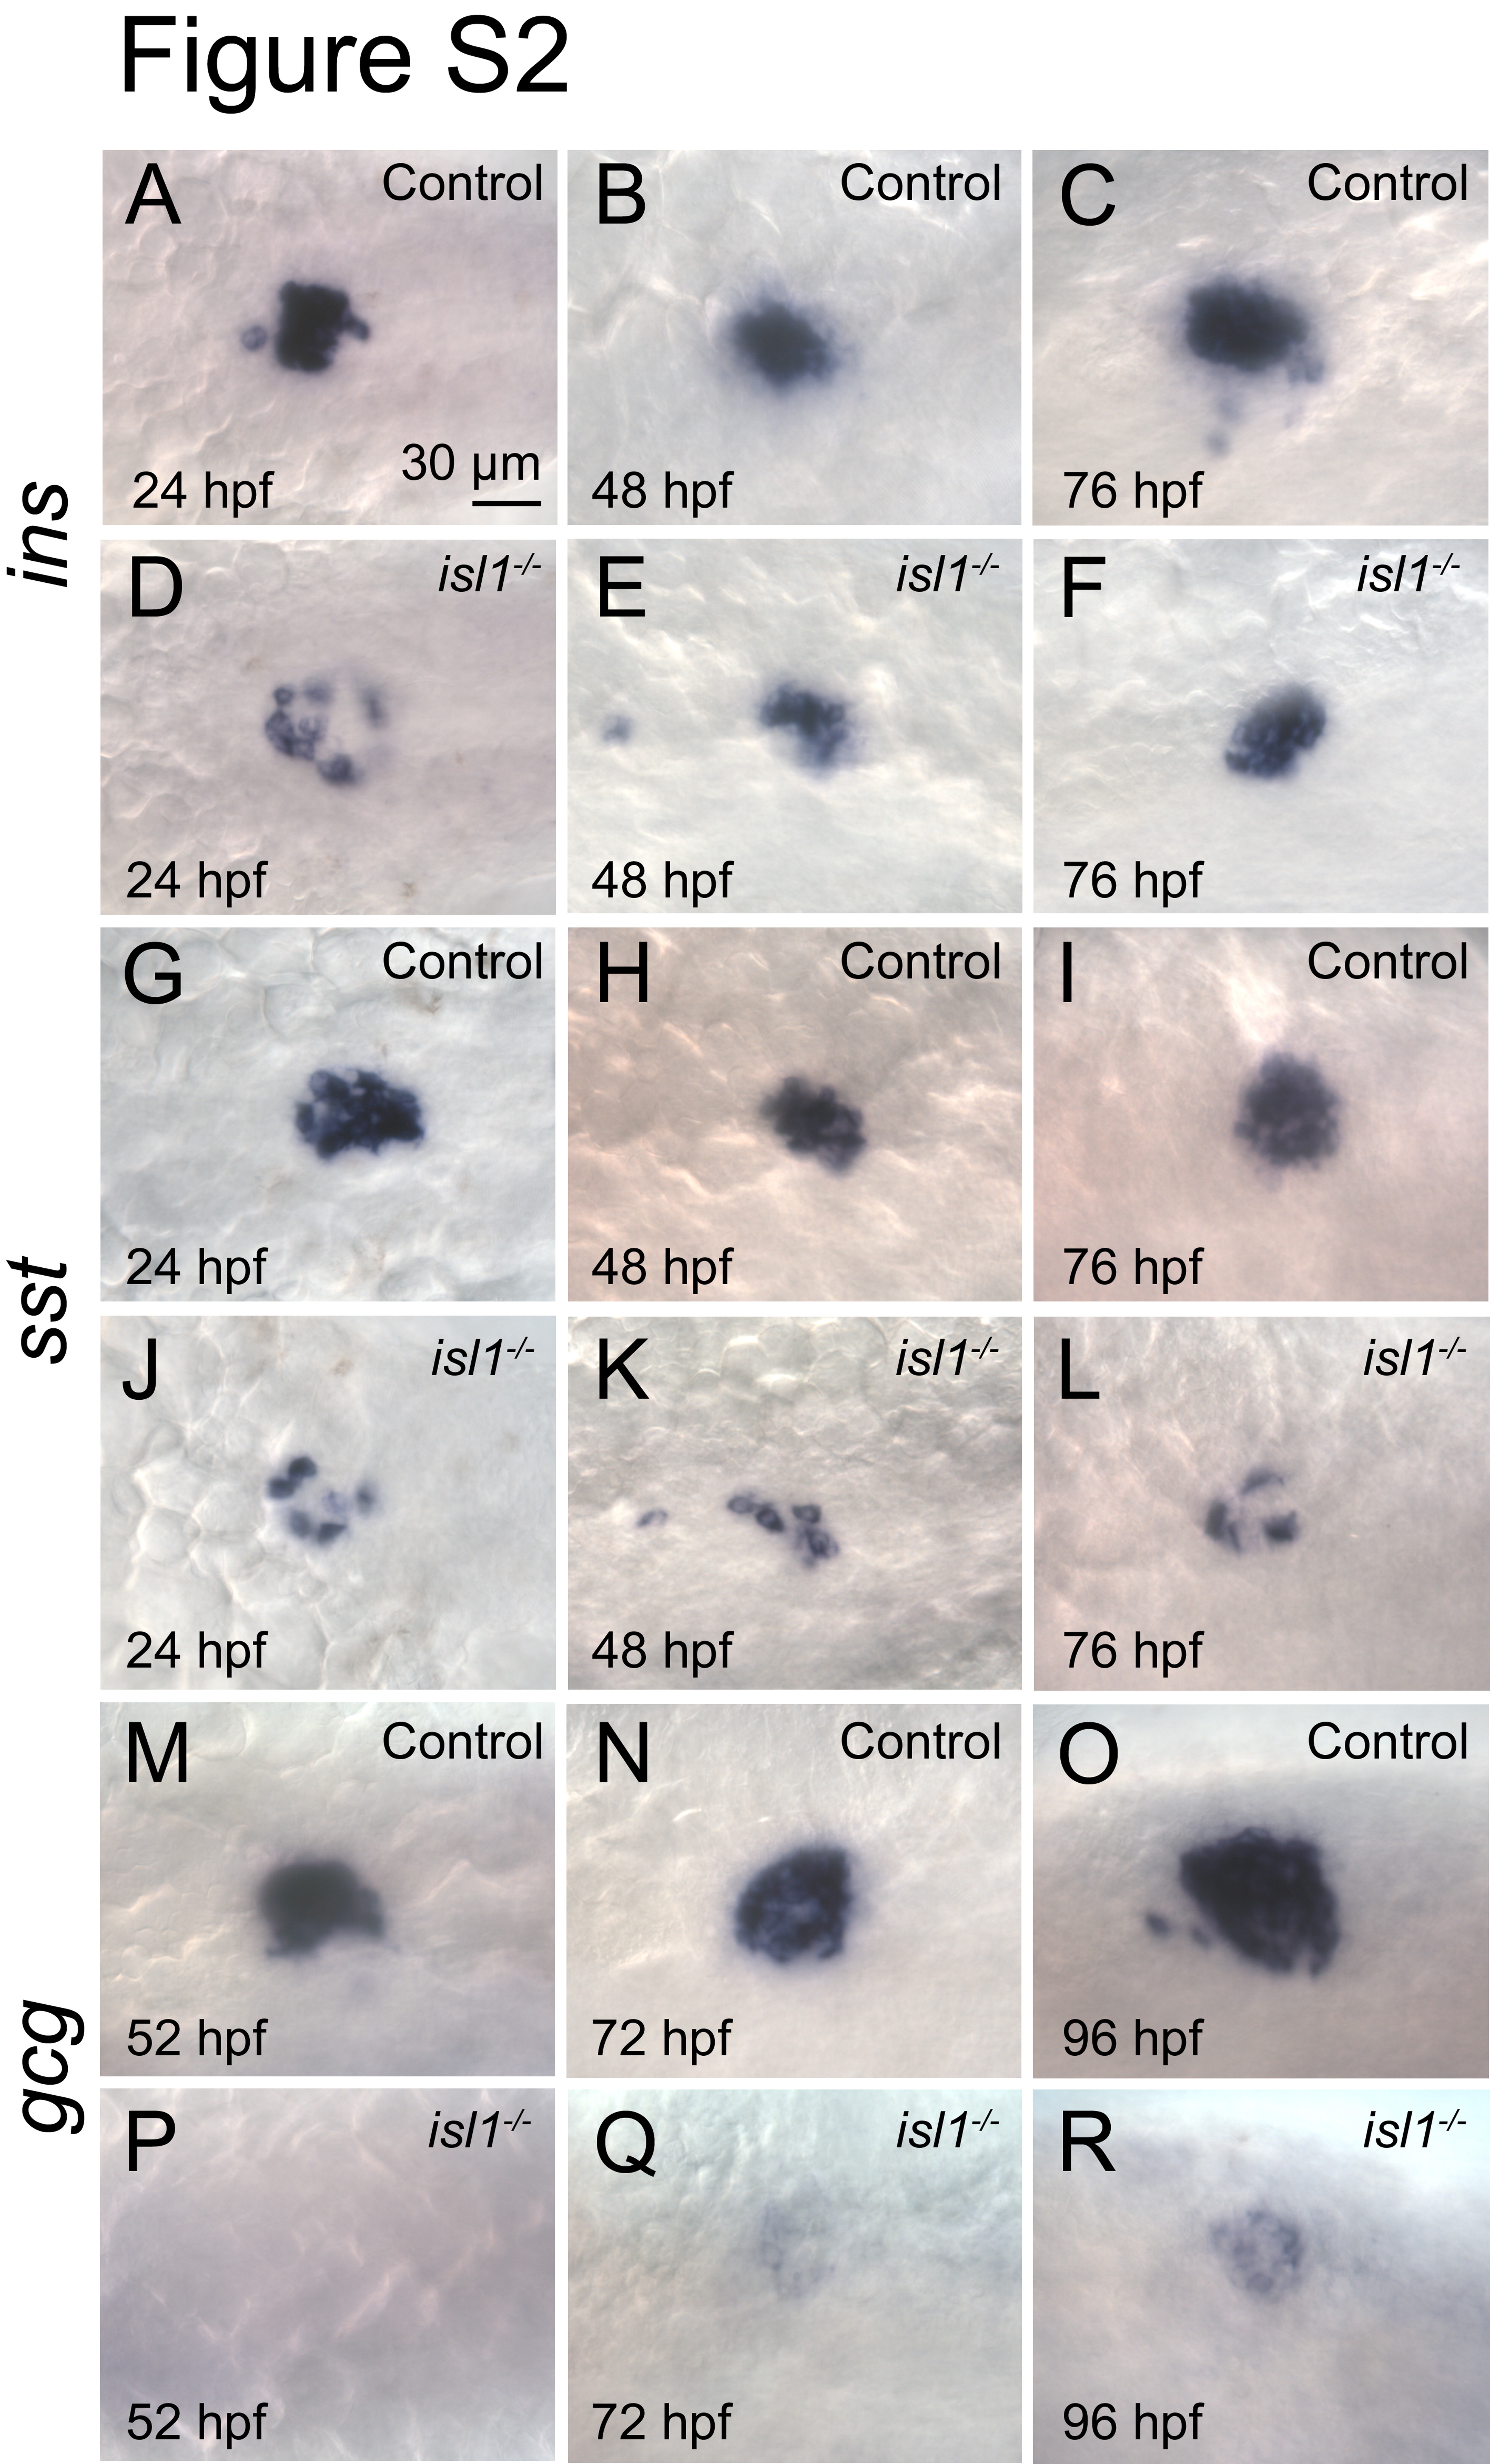
Fig. S2 Expression of ins, sst and gcg mRNA in control and isl1 mutants mRNA expression of ins (A?F), sst (G?L) and gcg (M?R) in the pancreatic islets of control embryos and isl1 mutants at the indicated stages. Note that in mutants the expression of ins and sst is strongly reduced at all stages analyzed, while glu is virtually absent at 52 hpf and strongly reduced at older stages. Images show a dorsal view with anterior to the left.
Acknowledgments
This image is the copyrighted work of the attributed author or publisher, and
ZFIN has permission only to display this image to its users.
Additional permissions should be obtained from the applicable author or publisher of the image.
Reprinted from Developmental Biology, 378(1), Wilfinger, A., Arkhipova, V., and Meyer, D., Cell type and tissue specific function of islet genes in zebrafish pancreas development, 25-37, Copyright (2013) with permission from Elsevier. Full text @ Dev. Biol.

