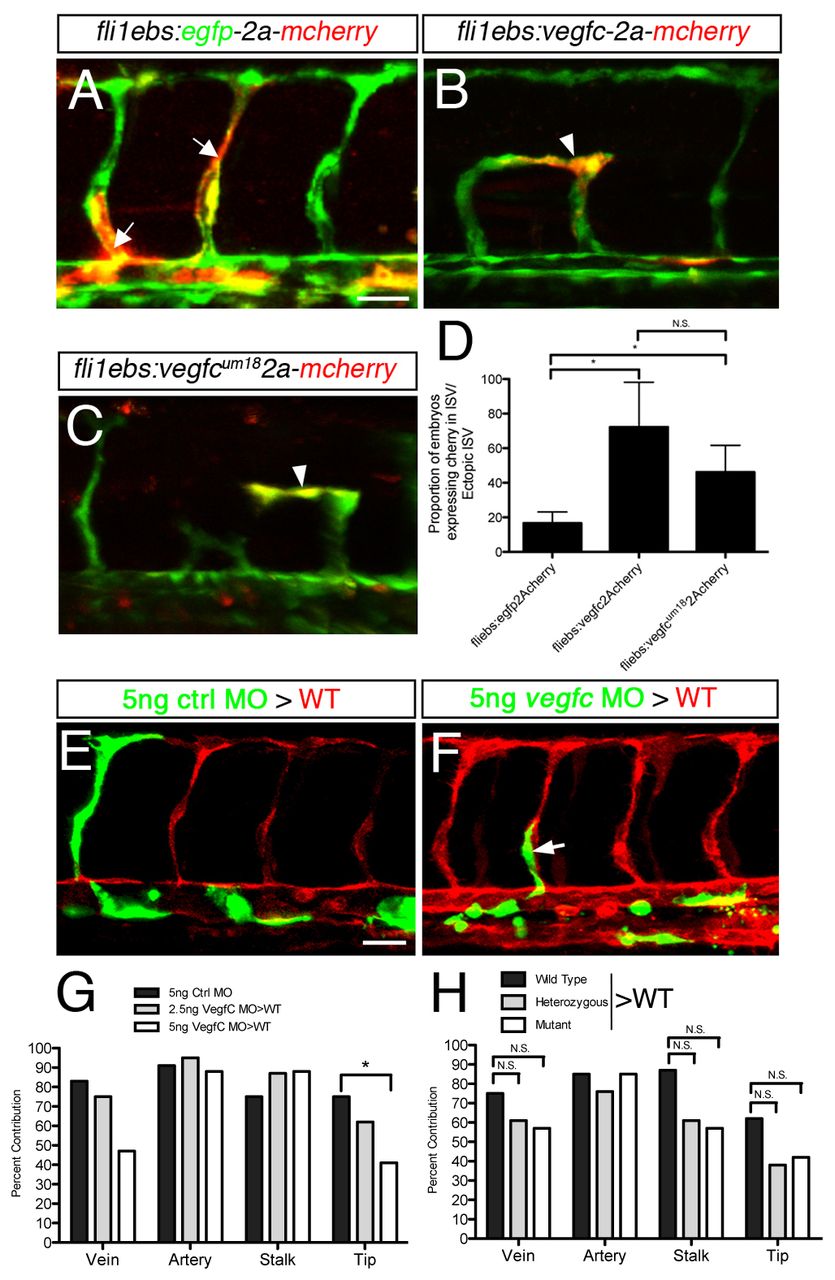
Fig. 5 Endothelial cell-autonomous effects of Vegfc on angiogenesis. (A-C) Confocal micrographs of trunk blood vessels in Tg(fli1a:egfp)y1 zebrafish embryos at 30 hpf. Anterior to the left, dorsal is up. Transgene expression (red fluorescence) is indicated in normal (arrow) or ectopically branched (arrowheads) ISVs. Embryos were co-injected with tol2 transposase mRNA and (A) pTol2-fliebs:egfp-2Acherry, (B) pTol2-fliebs:vegfc-2Acherry or (C) pTol2fliebs:vegfcum18-2Acherry. (D) Quantification of ectopic ISV branching in cells expressing the fliebs:egfp-2Acherry (n=12 embryos) or fliebs:vegfc-2Acherry (n=18 embryos) transgene. Values indicate the proportion of embryos with Cherry-positive ISVs displaying ectopic branching. (E,F) Confocal micrographs of trunk blood vessels at 30 hpf of Tg(kdrl:rasmcherry)s896 host embryos transplanted with Tg(fli1a:egfp)y1 cells (green) from embryos injected with 5 ng (E) control MO or (F) Vegfc MO. Arrow indicates a stalk cell. (G,H) The proportion of embryos displaying donor cells in the indicated trunk vessel position. (G) Donor cells from embryos injected with the indicated MO. (H) Donor cells were from embryos derived from an incross of vegfcum18 carriers. *P<0.05; N.S., not significant; error bars indicate s.e.m. Scale bars: 50 μm.
Image
Figure Caption
Acknowledgments
This image is the copyrighted work of the attributed author or publisher, and
ZFIN has permission only to display this image to its users.
Additional permissions should be obtained from the applicable author or publisher of the image.
Full text @ Development

