
Fig. 3
|
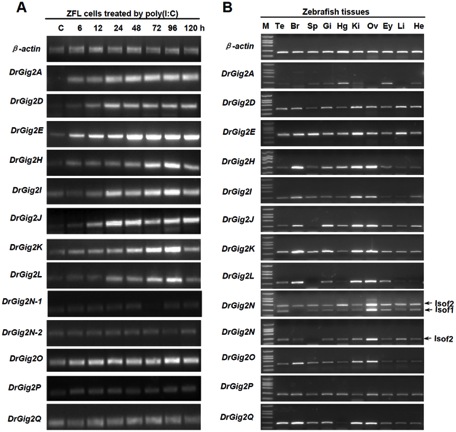
Fig. 3 Expression characterization of zebrafish Gig2 genes.
(A) ZFL cells seeded on 6-well plates overnight were transfected with 2 �g/ml poly(I:C) for 6, 12, 24, 48, 72, 96, and 120 h. Then total RNAs were extracted to examine the expression level of zebrafish Gig2 transcripts by RT-PCR. (B) RT-PCR detection of Gig2 transcripts in the indicated tissues from healthy zebrafish. β-actin was used as the endogenous control. Isof1 and Isof2 refer to the two isoforms of zebrafish Gig2N. All products of RT-PCR were checked by sequencing. M-Marker, Te-Testis, Br-Brain, Sp-Spleen, Gi-Gills, Hg-Hindgut, Ki-kidney, Ov-Ovary, Ey-Eye, Li-Liver, He-Heart.