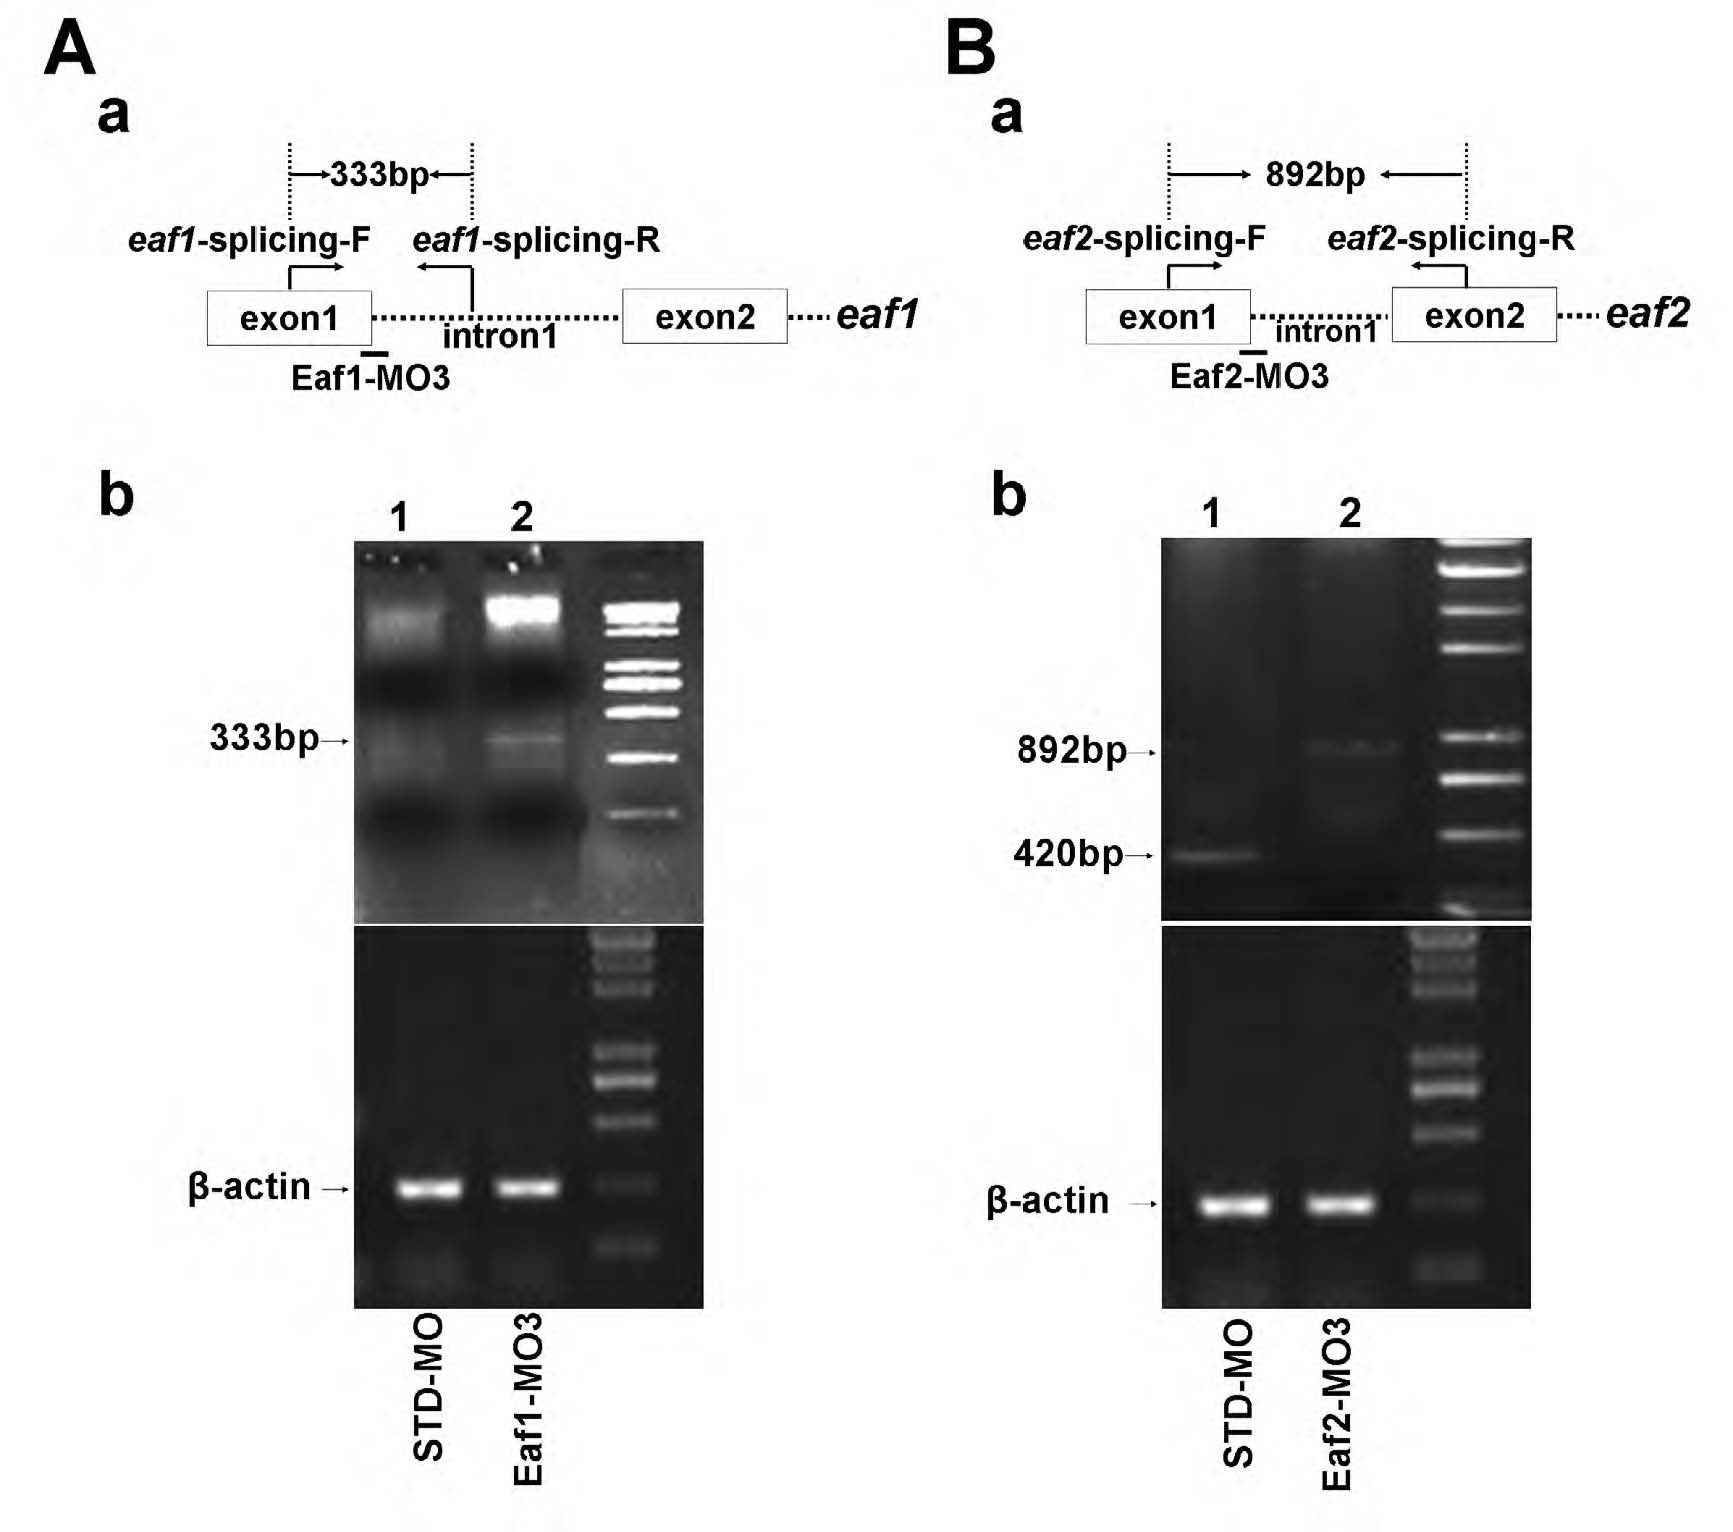
Fig. S2 Validation of Eaf1-MO3 and Eaf2-MO3. (A) (a) Schematic of eaf1 exon-intron structure, Eaf1-MO3 targeting position and RT-PCR primer locations. (b) In STD-MO injection embryos, an expected 333 bp band could not be detected by RT-PCR, but in embryos with Eaf1-MO3 injection, a 333 bp band could be detected by RT-PCR. (B) (a) Schematic of eaf2 exon-intron structure, Eaf2-MO3 targeting position and RT-PCR primer locations. (b) A 420 bp band was amplified from embryos injected with STD-MO by RT-PCR, but a 892 bp band was amplified from embryos injected with Eaf2- MO3, which contained intron 1 of eaf2. Embryos were collected at the bud stage for RNA extraction. Lane 1 is RNA from embryos injected with STD-MO, and lane 2 is RNA from embryos injected with Eaf1-MO3 (Ab) or Eaf1-MO3 (Bb).
Image
Figure Caption
Acknowledgments
This image is the copyrighted work of the attributed author or publisher, and
ZFIN has permission only to display this image to its users.
Additional permissions should be obtained from the applicable author or publisher of the image.
Full text @ Development

