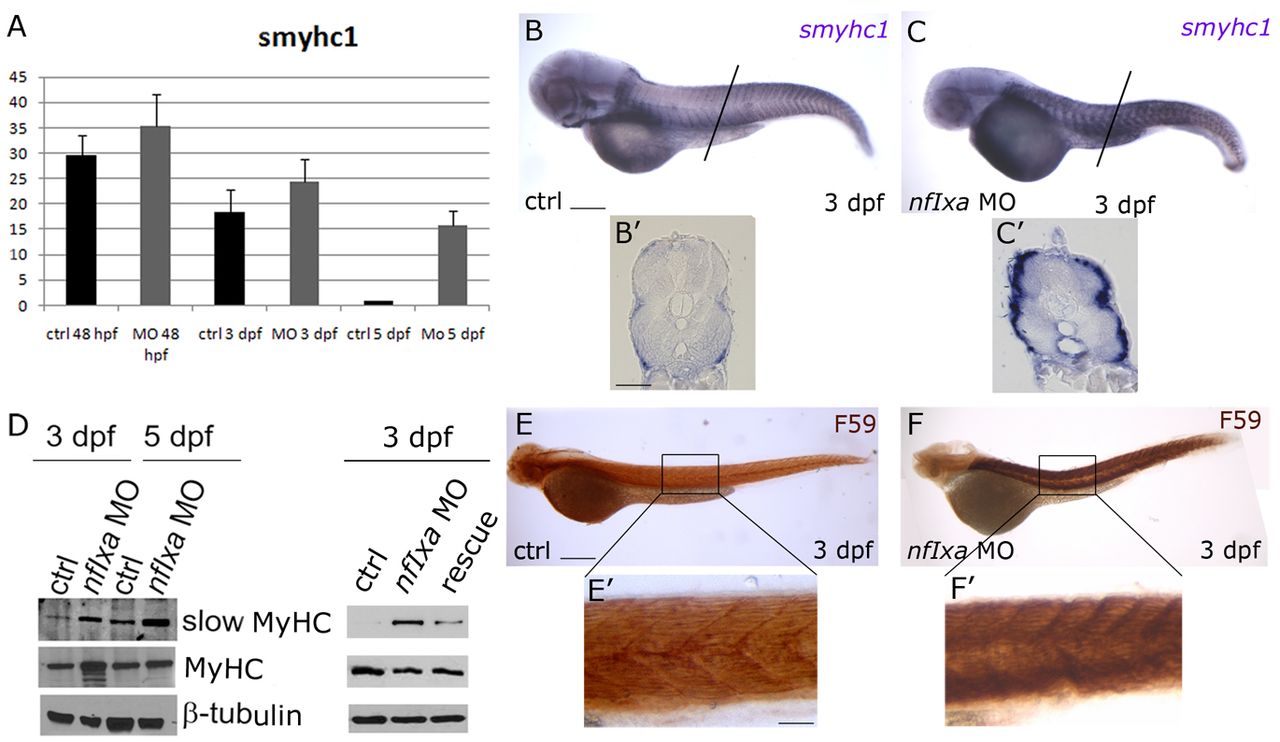
Fig. 4 Slow myosin remains expressed in nfixa-MO injected embryos after 48 hpf. (A) Quantitative real-time PCR (qRT-PCR) of smyhc1 mRNA expression normalized to ef1a. The expression of smyhc1 in control embryos presents a peak at 48 hpf and is then downregulated at 3 and 5 dpf. In nfixa-MO-injected embryos, the expression of smyhc1 remains elevated even after 48 hpf. (B-C′) Whole-mount in situ hybridization with smyhc1 probe replicates qRT-PCR results: at 3 dpf, nfixa-MO-injected embryos (C,C′) still present a stronger signal of smyhc1 than controls (B,B′). B′ and C′ are transverse sections of the tail. (D) Western blot: slow myosins are recognized by F59 antibody; all sarcomeric myosins are recognized by MF20 antibody. At 3 and 5 dpf in nfixa-MO injected embryos, slow and all myosin protein levels are higher than the control, whereas protein levels were recovered in rescued embryos at 3 dpf. Additional lower molecular weight bands in the 3 dpf nfixa-MO MyHC lane correspond to degradation products of the protein. (E-F′) Immunostaining with F59 antibody (slow fibers): at 3 dpf, nfixa-MO-injected embryos (F,F′) present a stronger F59 signal than the control (E,E′). Insets in E2 and F2 show a higher magnification of the tail region. In all figures, lateral views are shown, anterior is always towards the left. Scale bars: 100 μm in B,B′,C,C′,E,F; 200 μm in E′,F′.
Image
Figure Caption
Figure Data
Acknowledgments
This image is the copyrighted work of the attributed author or publisher, and
ZFIN has permission only to display this image to its users.
Additional permissions should be obtained from the applicable author or publisher of the image.
Full text @ Development

