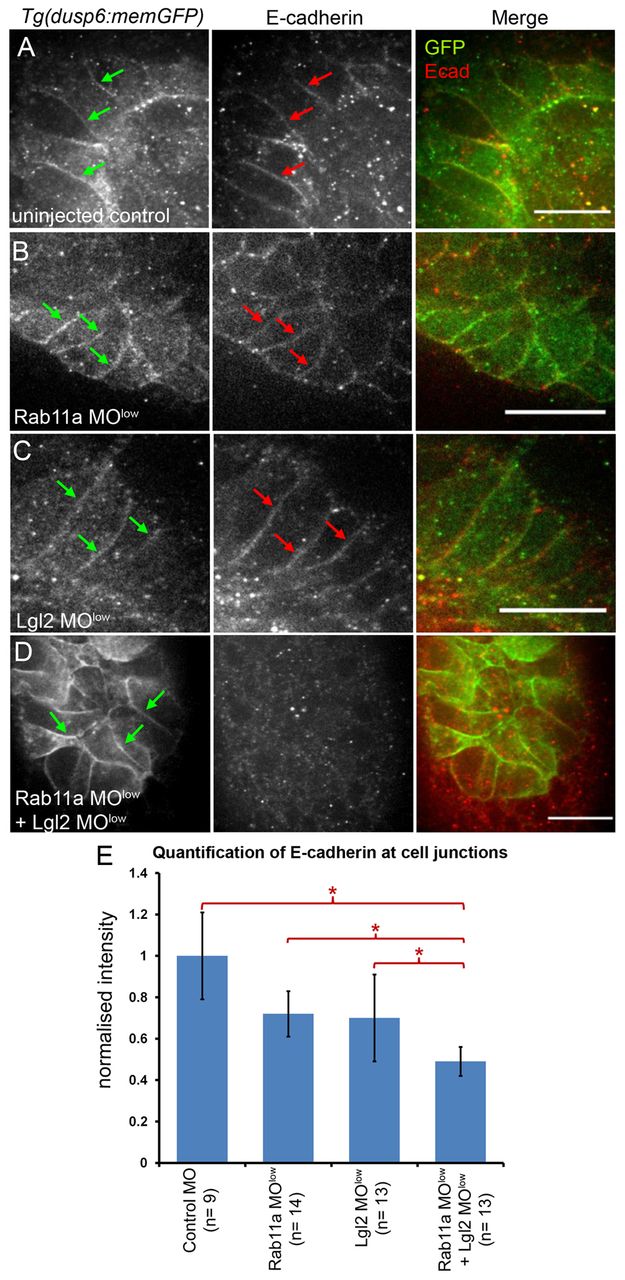
Fig. 6 Lgl2 and Rab11a control E-cadherin accumulation at KV cell junctions. (A-D) Optical sections showing E-cadherin immunostaining in KV cells of Tg(dusp6:memGFP) embryos. GFP (green arrows) and E-cadherin (red arrows) accumulate at lateral membranes in control (A), Rab11a MOlow (B) and Lgl2 MOlow (C) embryos. E-cadherin membrane staining was reduced in Rab11a MOlow + Lgl2 MOlow embryos (D). Scale bars: 20 μm. (E) Quantification of E-cadherin staining along lateral KV membranes. Average fluorescence intensities from multiple experiments were normalized to controls. Error bars indicate s.d. n, number of embryos analyzed. *P<0.05.
Image
Figure Caption
Figure Data
Acknowledgments
This image is the copyrighted work of the attributed author or publisher, and
ZFIN has permission only to display this image to its users.
Additional permissions should be obtained from the applicable author or publisher of the image.
Full text @ Development

