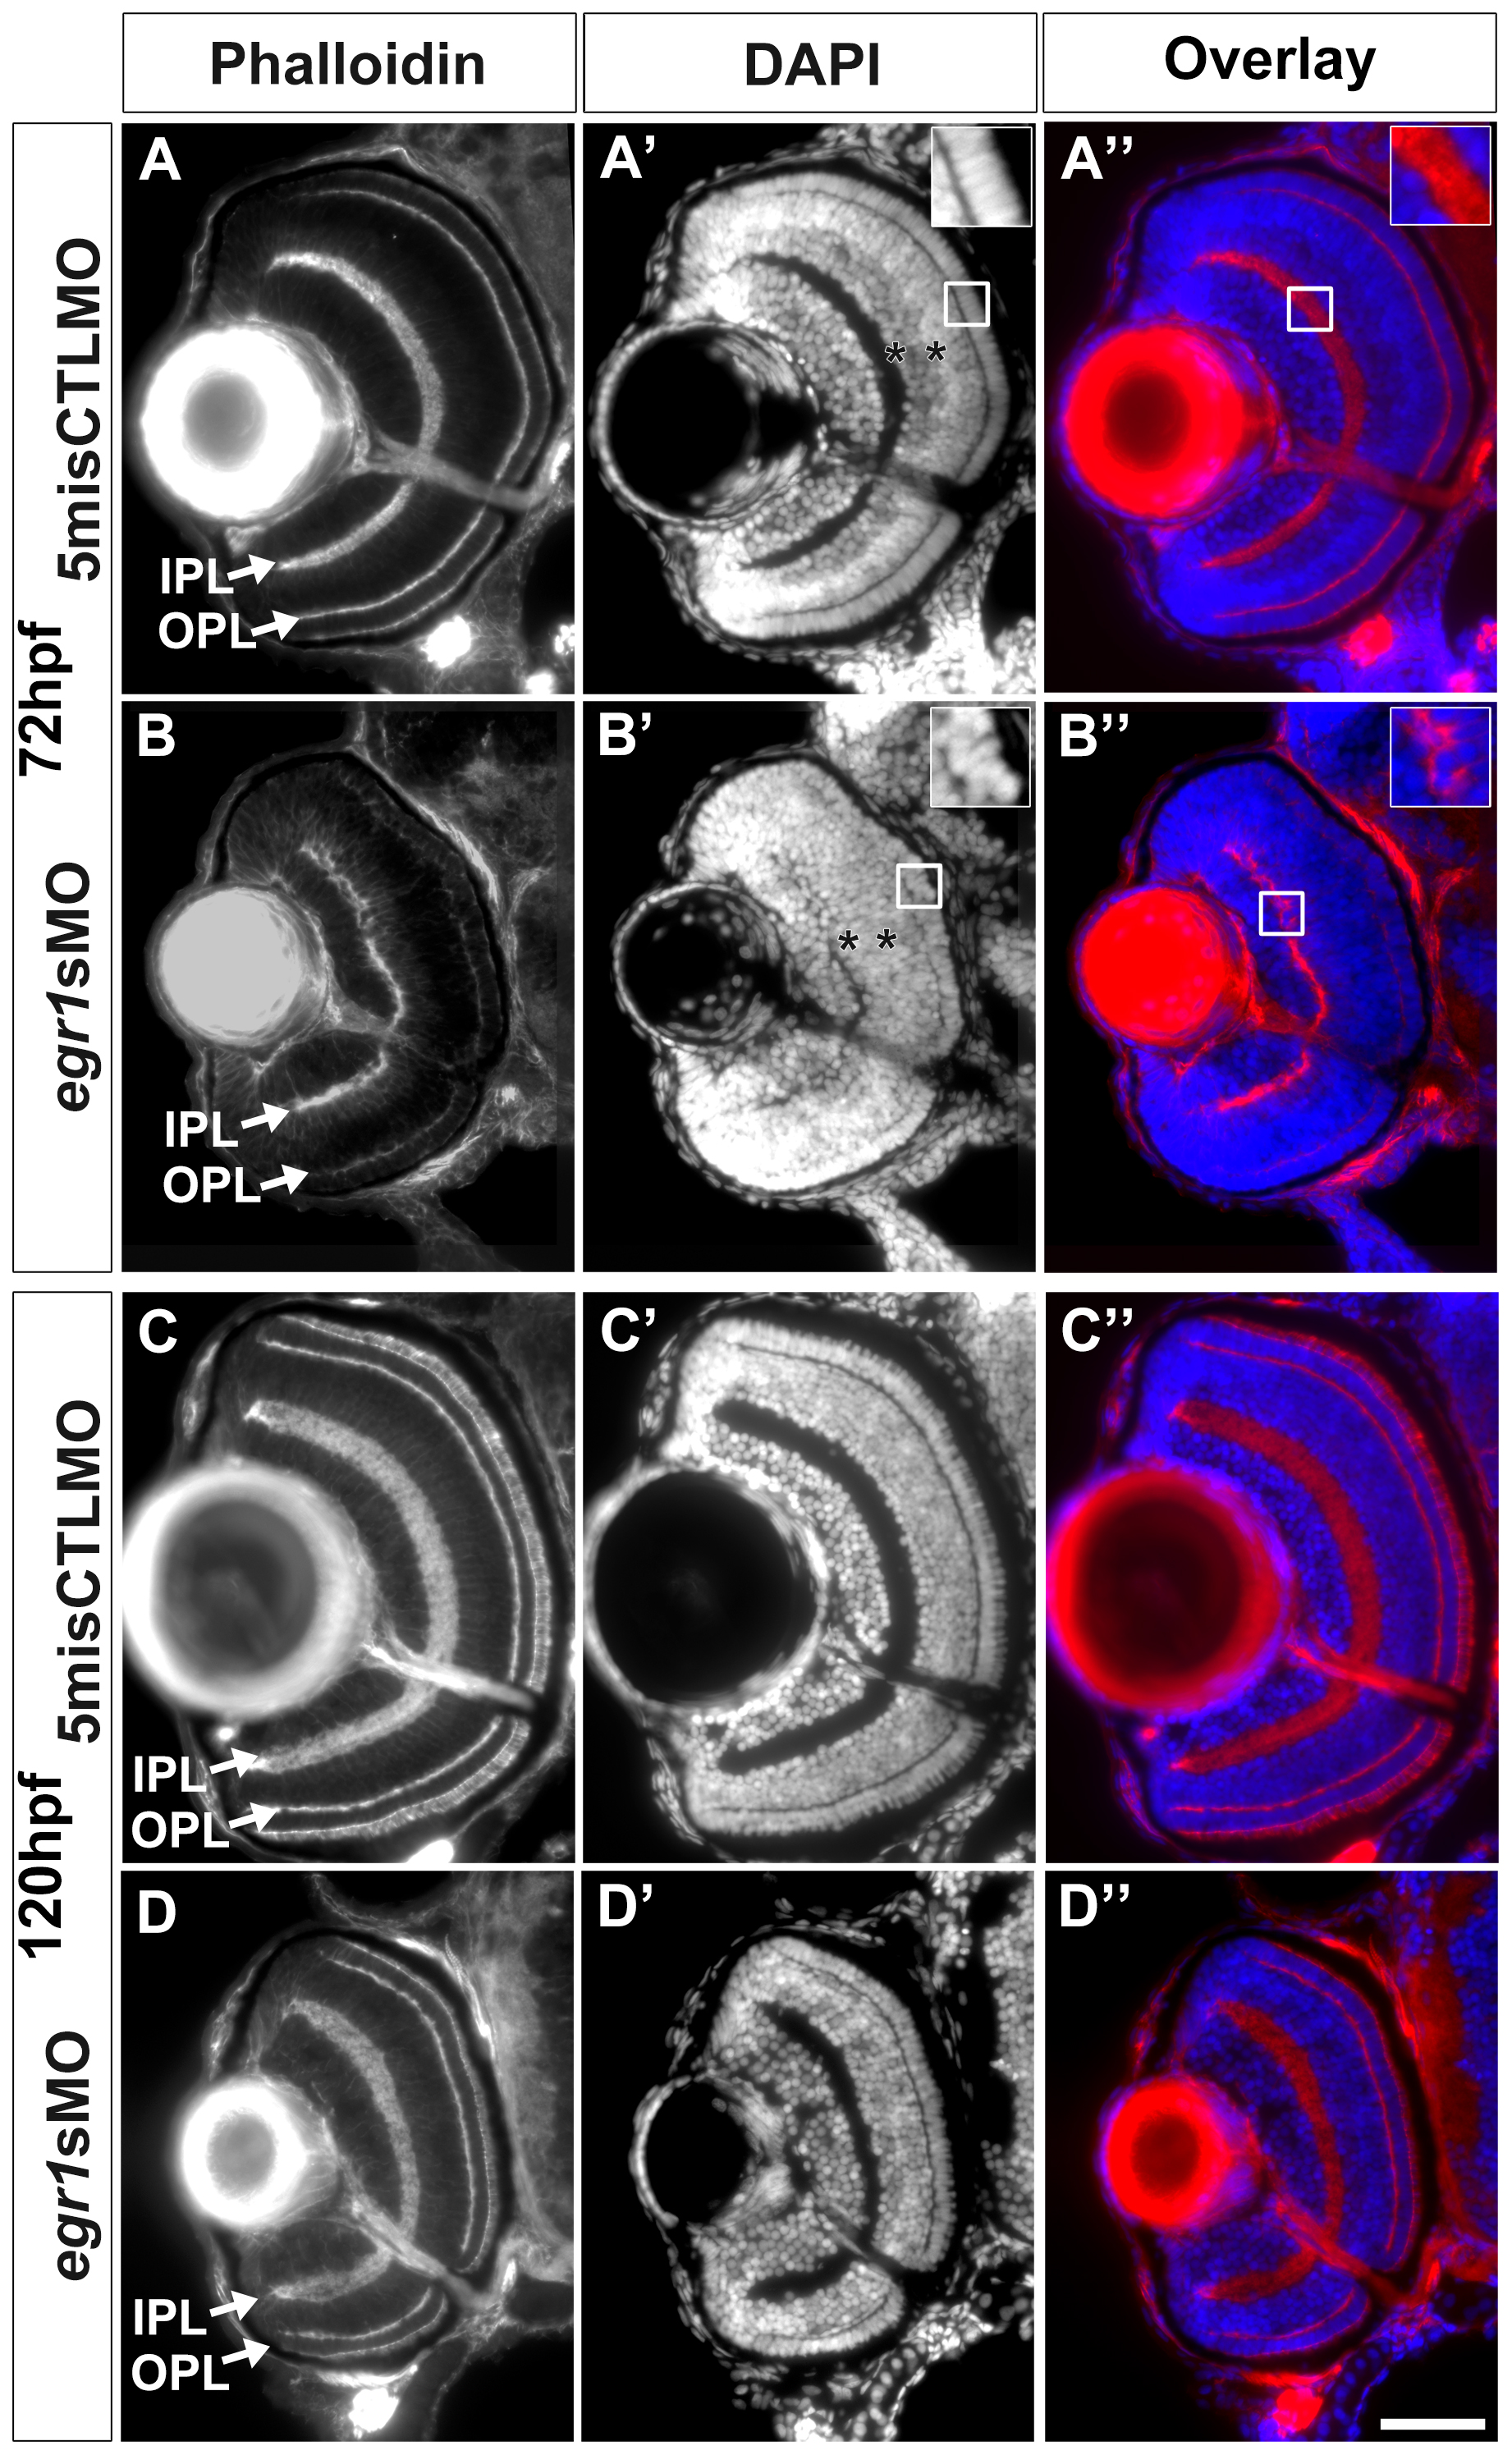
Fig. 3 Egr1 knockdown compromised retinal differentiation and lamination at 72 hpf, and these defects were mostly resolved by 120 hpf.
The retinal histology of the Egr1-morphant retinas was analyzed by immunofluorescence. (A & B) The IPL and OPL (arrows) that were stained with phalloidin were thinner and irregular in the Egr1 morphants (egr1sMO) compared with the controls (5misCTLMO) at 72 hpf. A similar observation of the plexiform layer formation was also made with the DAPI nuclei stain on the same sections (A′ and B′). The DAPI stain also revealed issues in the differentiation of INL and ONL. For example, while a more intense apical sub-layer and a less intense basal sub-layer were observed in the INL of the controls (A′, asterisks), this distinction was not apparent in the Egr1 morphants (B′, asterisks). This suggests that the differentiation of the INL was compromised in the morphant retinas. Further, the nuclei in the ONL of the Egr1 morphants (B′, inset) were less elongated than that in the controls (A′, inset), suggesting that PR differentiation was affected by Egr1 knockdown. The overlay pictures of phalloidin and DAPI also demonstrate that the irregularity of the IPL was caused by mis-placed cells in the IPL in the Egr1 morphants (B′′, inset); while no mis-placed cells were found in the controls (A′′, inset). By 120 hpf, many of these differentiation problems in the Egr1-morphant retinas were largely resolved. For example, the IPL and OPL were more regular and their phalloidin staining was more intense (D) and was comparable to the controls (C). Nonetheless, the IPL was still thinner in the Egr1 morphants. In addition, the PRs in the Egr1 morphants was not stained as intensely by phalloidin as the controls, even though the differentiation of PRs became relatively normal at this stage (see Figure 7). For all sections, the lens is on the left and dorsal is up. IPL: inner plexiform layer; OPL: outer plexiform layer. Scale bar = 50 Ám.

