
|
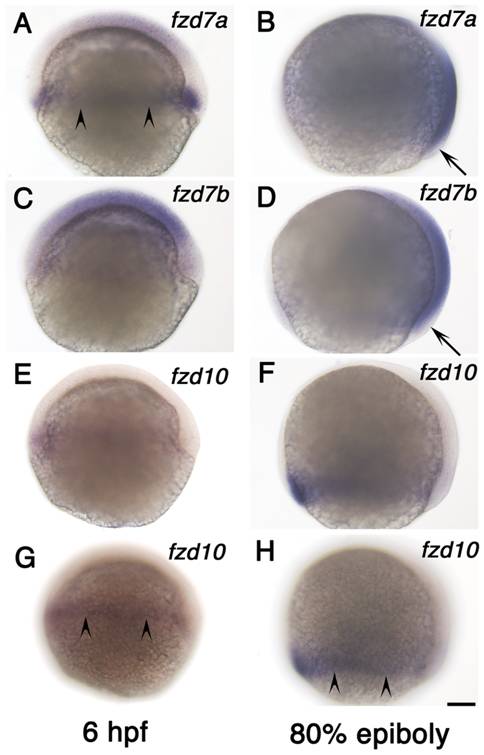
Fig. 6 Expression of fzd7a, fzd7b and fzd10 at gastrula stage.
A, B) fzd7a expression. C, D) fzd7b expression. E?H) fzd10 expression. Left column shows expression at 6 hpf and right column shows expression at 80% epiboly stage as indicated. All are left side views with anterior to the top. Embryos in panel E and G, and embryos in panel F and H are the same ones. We focused on medial plane along the animal-vegetal axis for embryos in panel A?F. Embryos in panel G and H alone were focused on lateral surface to show signal in marginal area. Arrowheads in panels A, G, H indicate the marginal expression, and arrows in B and D show the lack of expression (see text). Scale bar: 100 μm.