
|
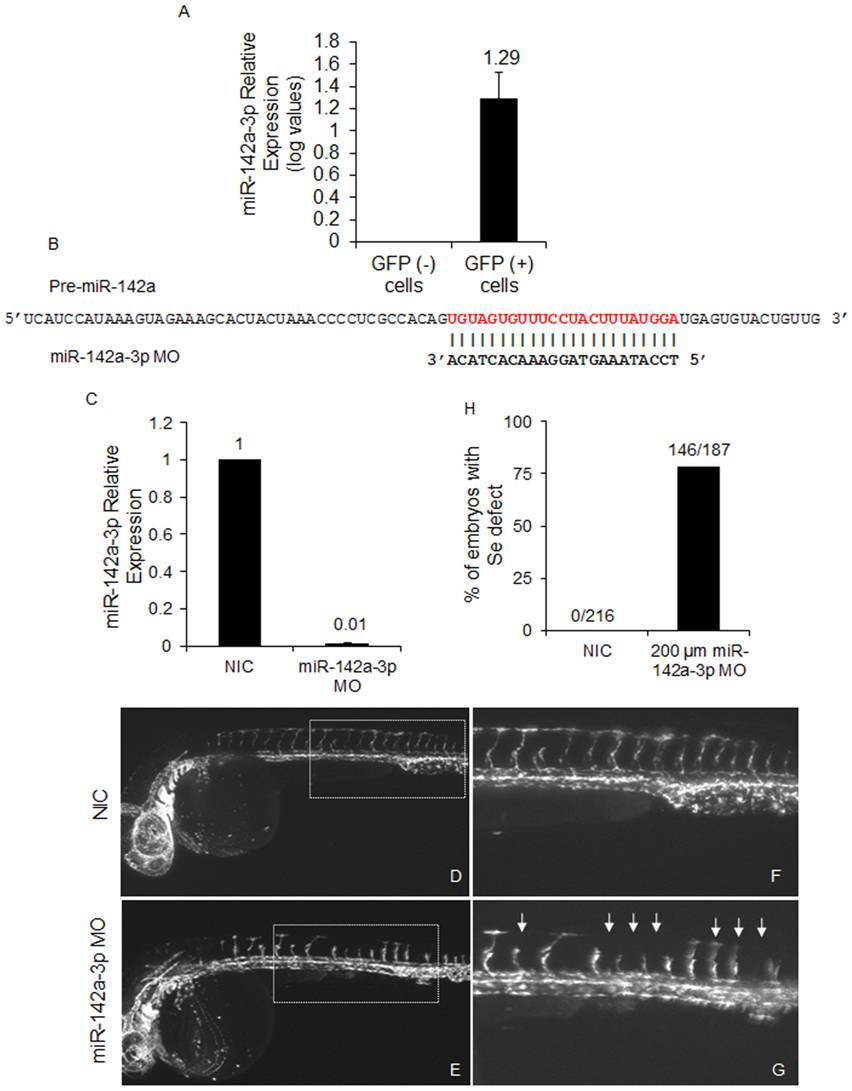
Fig. 5 Loss of miR-142a-3p leads to intersegmental vessel remodeling.
A ?Relative quantification of miR-142a-3p in GFP positive (+) and GFP negative (-) cells of 2 dpf Tg(fli1:EGFP, gata1a: dsRed) zebrafish embryo by real-time PCR. Total RNA was isolated from 2 dpf FAC sorted GFP (-) and GFP (+) cells of 2 dpf Tg(fli1:EGFP, gata1a: dsRed) zebrafish embryos. 200 ng of total RNA was used for preparing cDNA using QuantiMir kit, SBI, USA and diluted by 1:1 for RT-PCR assay. The assay has been performed using ??CT method (??CT = (CT miRNA - CT reference RNA) - (CT calibrator - CT reference RNA) as described previously [45]. U6 and beta-actin was used as calibrator and reference control respectively. Data collected from 3 independent experiments is represented as mean fold change � SD. B ? Schematic alignment of miR-142a-3p MO with pre-miR-142a. Mature miR-142a-3p sequence is in red color. C - Relative quantification of mature miR-142a-3p in non-injected control (NIC) and embryos injected with 200 �M miR-142a-3p MOs at 2 dpf. The assay was performed as described by manufacturer (QuantiMir kit, SBI, USA). The relative expression of miR-142a-3p was normalized to miR-26a. Data collected from 3 independent experiments is represented as mean fold change � SD. D - G - Representative image of 28?30 hpf Tg(fli1:EGFP, gata1a: dsRed) zebrafish embryos. Inset displaying intersegmental vessels from non-injected control and 200 μM miR-142a-3p morpholino injected embryos. Images are arranged in a lateral view and inset displaying 11?15 intersegmental vessels from the trunk region. The images are taken at 5� and 10� magnifications. Arrowheads indicate regions with vascular defects. H - Bar graph showing embryos with inter-segmental vessel defects in non-injected control (NIC) and 200 μM miR-142a-3p morpholino injected embryos at 28?30 hpf.