
Image
|
Figure Caption
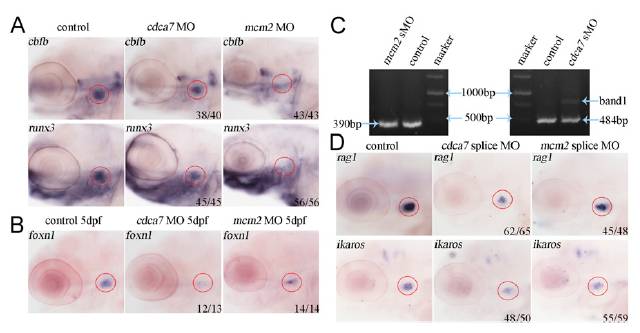
Fig. S5 The expression of T-cell markers and TEC markers in mcm2 and cdca7 morphants. (A) The expression of T-cell markers, including cbfb, and runx3, in mcm2 and cdca7 morphants. (B) The expression of foxn1 was reduced in mcm2 and cdca7 morphants at 5 dpf. (C) Verification of mcm2- and cdca7 splice MOs using RT-PCR. (D) The expression of rag1 and ikaros in mcm2- and cdca7 morphants injected with splice MOs. Anterior to the left and dorsal to the up; circles mark the thymus.
Acknowledgments
This image is the copyrighted work of the attributed author or publisher, and
ZFIN has permission only to display this image to its users.
Additional permissions should be obtained from the applicable author or publisher of the image.
Full text @ Proc. Natl. Acad. Sci. USA