
|
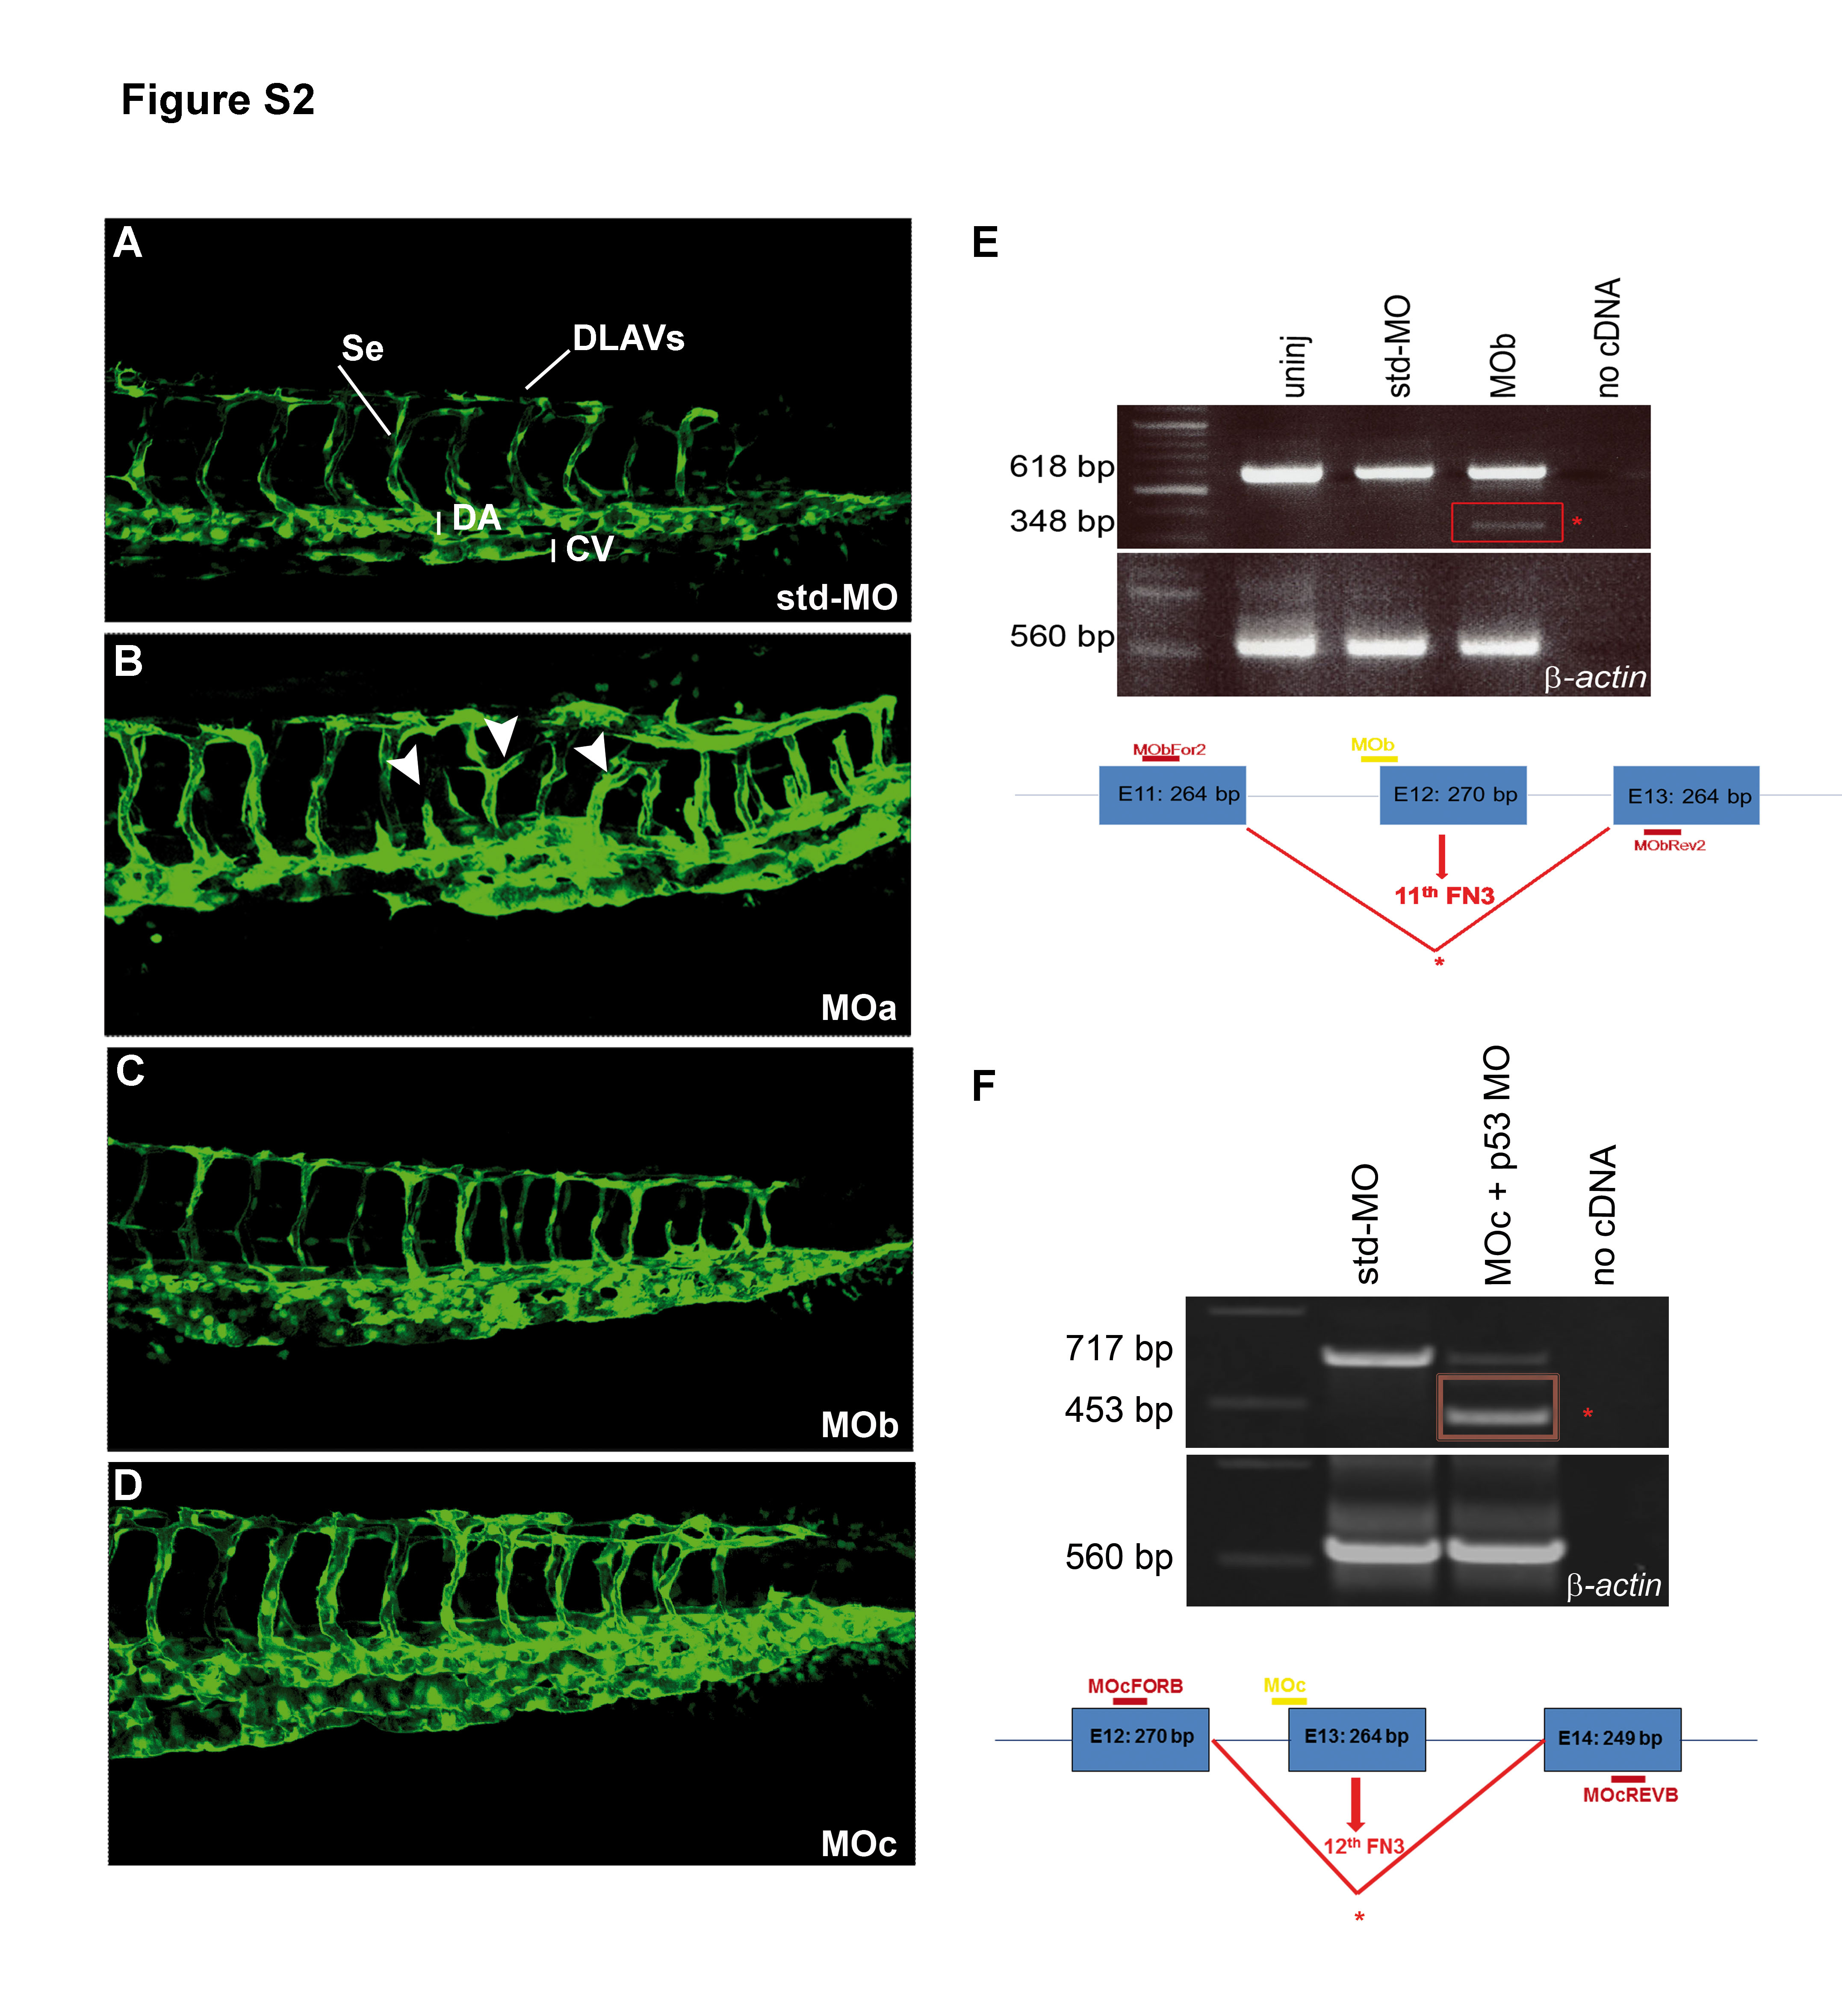
Fig. S2 The zve-ptp MOa injection caused angiogenic defects at 2 dpf.
(A?D) Confocal images of the tail of tg(fli1:EGFP)y1 embryos injected with std-MO (A), zve-ptp MOa (B), zve-ptp MOb (C) and zve-ptp MOc (D). Embryos injected with MOa display intersomitic vessels which are either truncated or characterized by anomalous branching (white arrowhead). Se: intersomitic vessels; DLAVs: dorsal longitudinal anastomotic vessels; DA: dorsal aorta; CV: caudal vein. (E?F) The efficiency of splice-blocking is tested by RT-PCR with primers designed on the exons flanking the MO target site. The injection of selected doses of splice-blocking MOs (0.5 pmol/embryo of MOb and co-injection of 0.2 pmol/embryo of MOc with 0.3 pmol/embryo of p53 MO) resulted in the presence of the expected wild-type fragment and the generation of an additional smaller band (red box) corresponding to an aberrant transcript. The sizes of the obtained PCR fragments are indicated. Diagrams in E and F show the position of the zve-ptp MOb (MOb; designed on the intron 11/exon 12 boundary), the position of the zve-ptp MOc (MOc; designed on the intron 12/exon 13 boundary) and the position of the specific primers (MObFOR2-MObREV2 and MOcFORB-MOcREVB). Boxes represent exons (E11 to E14). The size of each exon is indicated in the respective box.