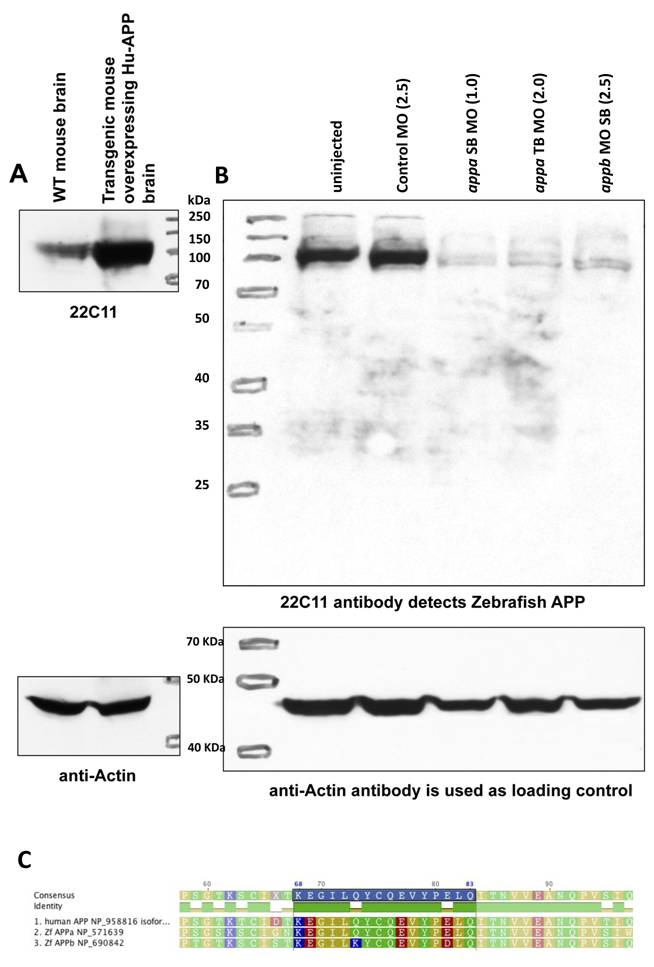
Fig. S3 Efficacy of appa and appb MO?s assessed by western blot. MO knockdown reagents were assessed by Western blot to quantify protein abundance. Parts of this data appear in Fig. 1M. A. The size of the APP-immunoreactive bands in wild type mouse brain or from TgCRND8 mouse brains overexpressing human APP as detected with the antibody 22C11. B. Zebrafish App proteins are detected with 22C11 and the bands are indistinguishable from mammalian APP observed in panel A. Knockdown of zebrafish appa or appb gene products with various MO reagents (See Fig. 1, doses in nanograms are presented in brackets at the top of the figure) results in a significant reduction of APP immunoreactivity as normalized to β-actin levels and compared to control MO-injected fish. Smaller protein products that might be predicted to have a dominant effect following injection of splice blocking MOs are not detectable (predicted size of MO-altered proteins are 10 and 20 kDA for Appa and Appb, respectively). C. The 22C11 epitope (highlighted in blue) is conserved between human (top line) and zebrafish (Zf) proteins Appa (16/16 residues identical) and Appb (14/16 residues identical, 15/16 residues with conserved identity). Identity of the region is represented on the graph above the alignment with green showing perfect identity and amber showing mismatches.
Image
Figure Caption
Figure Data
Acknowledgments
This image is the copyrighted work of the attributed author or publisher, and
ZFIN has permission only to display this image to its users.
Additional permissions should be obtained from the applicable author or publisher of the image.
Full text @ PLoS One

