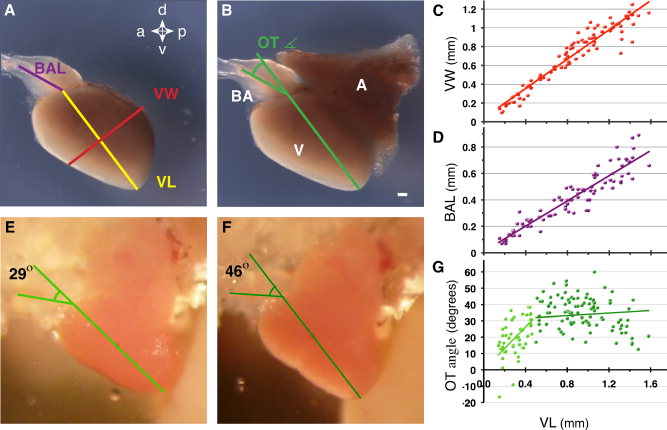
Fig. 3 Quantitative cardiac analysis. To better understand cardiac maturation, we carried out a series of quantitative analyses. A,B: Measurements taken for each external cardiac feature; for better characterization of the ventricular morphology, the atrium in (B) has been removed in (A). Bulbous arteriosus length (BAL- purple), ventricle length (VL- yellow), and ventricle width (VW- red) are labeled. B,E,F: The outflow tract angle (OT angle) is indicated in green. C: VW increases linearly with VL. D: BA length increases linearly with VL, staying approximately half the length of the ventricle. The outflow tract (OT) angle changes throughout each cardiac contraction by as much as 30°. E,F: Images extracted from a Supp. Movie S5 demonstrate a minimal OT angle of 29° during ventricular ejection (E) and a maximal OT angle of 46° following atrial systole (F). G: During embryonic and larval development that ends at a VL of 0.5 mm, the OT angle, increases quickly followed by a period of very slow change through adulthood. BA, bulbous arteriosus; V, ventricle; A, atrium; a, anterior; p, posterior; d, dorsal; v, ventral orientation. Scale bar = 100 μm.
Image
Figure Caption
Acknowledgments
This image is the copyrighted work of the attributed author or publisher, and
ZFIN has permission only to display this image to its users.
Additional permissions should be obtained from the applicable author or publisher of the image.
Full text @ Dev. Dyn.

