
|
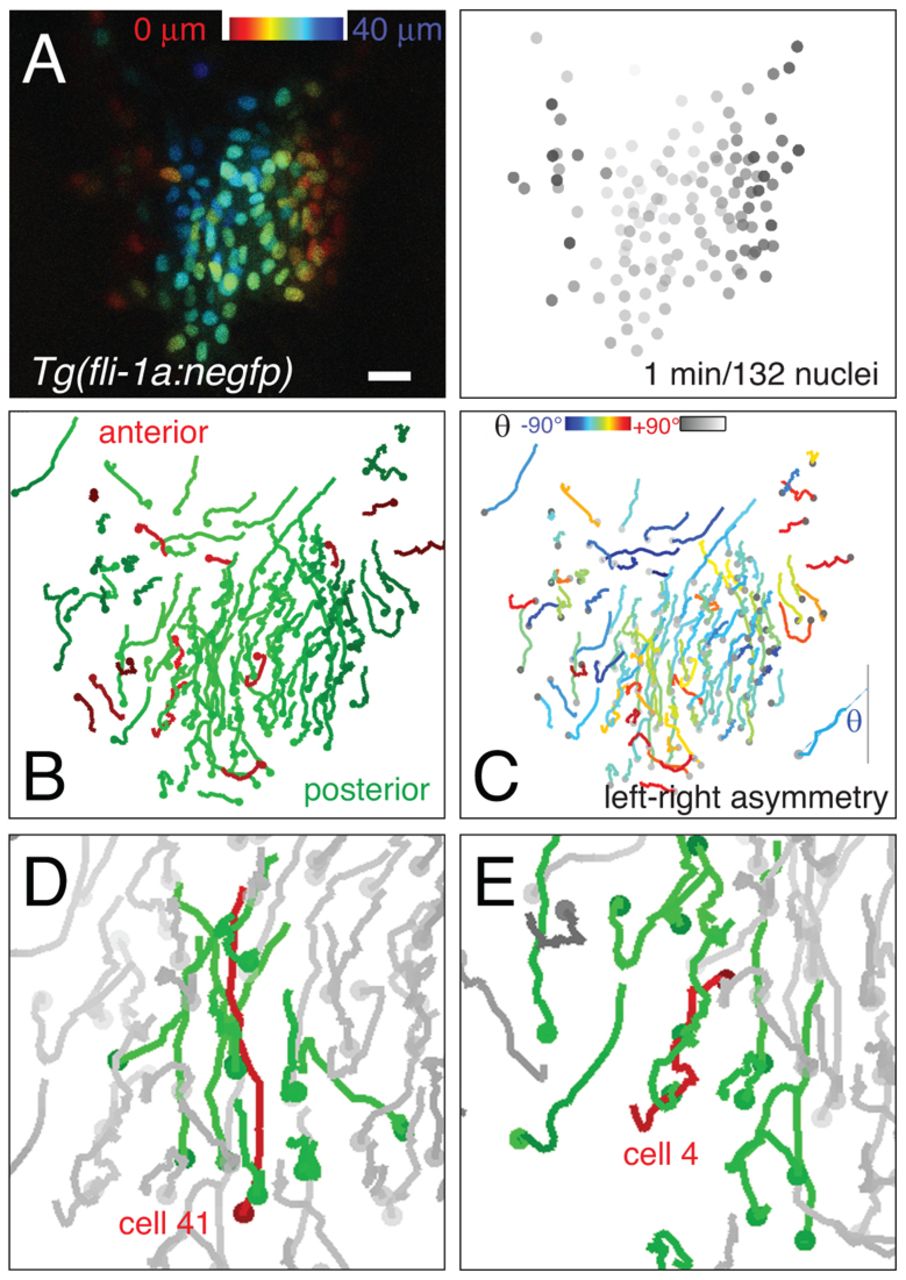
Fig. 7 Asymmetric migration patterns of zebrafish endocardial nuclei. (A) Left: Endocardial progenitors labeled with Tg(fli1a:negfp). Dorsal view, posterior is down. Scale bar: 10 μm. Right: Frame from a single confocal movie of 1-minute intervals, together with the corresponding frame of the 132 individual nuclei tracked using NucleiTracker4D. Grayscale depth code reveals dorsal angioblasts (dark gray) at lateral positions. (B) Overall posterior movement of endocardial nuclei; trajectories are color coded according to their net movement along the anterior-posterior axis. (C) Left-right asymmetry of endocardial migration; trajectories are color coded by net angle θ relative to the anterior-posterior axis. In this movie, 88 cells moved leftward and 44 cells rightward. (D) Example of correlated trajectories of a target cell (cell 41) and its nearest neighbors. (E) Example of target cell (cell 4) moving in the opposite direction to its neighbors.