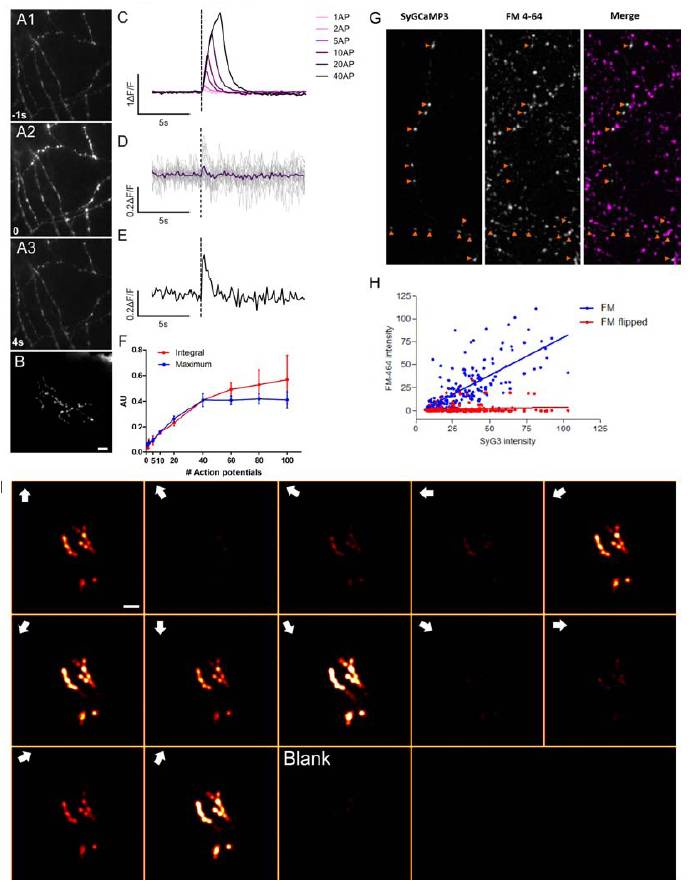
Fig. S1 Functional characterisation of SyGCaMP3 in dissociated rat hippocampal neurons in vitro, (A1-A3) SyGCaMP3 fluorescence before (A1), during (A2) and 4s after (A3) whole-field stimulation. Note punctate distribution of SyGCaMP3 and increased fluorescence during stimulation. (B) SyGCaMP3 expression in a single RGC in vivo showing a punctuate distribution. (C) Average responses of 23 boutons measured from a single hippocampal neuron to a single action potential and trains of 2, 5, 10, 20 and 40 action potentials delivered at 20 Hz. (D) SyGCaMP3 responses to single action potentials measured in 23 single boutons from a single hippocampal neuron. Individual responses are shown in grey traces; mean response is shown in blue. (E) Example of SyGCaMP3 response to a single action potential measured in a single bouton. (F) Dynamic range of two summary metrics with the maximum %?F/F saturating with stimuli greater than 40 action potentials whereas the integral continues beyond this stimulus level. Thus, using the integral response post-stimulation provides a summary metric that extends the dynamic range of the calcium sensor. (G) Labelling of SyGCaMP3-transfected hippocampal cultures with FM4-64 (a marker of activity-dependent synaptic vesicle endo- and exocytosis) demonstrates that accumulations of SyGCaMP3 are sites of presynaptic vesicle release. A single SyGCaMP3 neuron is shown in the left panel, FM4-64 staining in the central panel, and a merged image is shown on the right. 96.4% of SyGCaMP3 puncta colocalise with FM4-64 staining (n=192 puncta from 2 cultures). When the SyGCaMP3 image is flipped vertically relative to the FM4- 64 image 25% of SyGCaMP3 puncta colocalise with FM4-64 label. This provides an estimate of colocalisation arising through chance due to the high density of FM4-64 staining. Our results showing the correlation between GCaMP3-reported presynaptic calcium and vesicular release confirms those of Li et al., 2012. (H) SyGCaMP3 intensity at individual puncta correlates with FM4-64 staining intensity in correctly orientated images (FM, blue data points, F1,190=198, P<0.0001) but not when the SyGCaMP3 image is flipped relative to the FM4-64 images (FM flipped, red data points F1,190=2.094, P=0.15). (I) Montage showing the response of a single RGC expressing SyGCaMP3 to each stimulus epoch. Voxels are colour-coded according to the response integral during each stimulus epoch (the response metric used to calculate orientation and direction-selectivity). Note that signal changes are confined to SyGCaMP3 puncta at all response amplitudes. Direction of motion during each stimulus epoch is shown in the top left hand corner of each panel. Responses of this cell across the entire experiment are shown in supplementary movie 3. Scale bar=5μm.
Image
Figure Caption
Acknowledgments
This image is the copyrighted work of the attributed author or publisher, and
ZFIN has permission only to display this image to its users.
Additional permissions should be obtained from the applicable author or publisher of the image.
Full text @ Neuron

