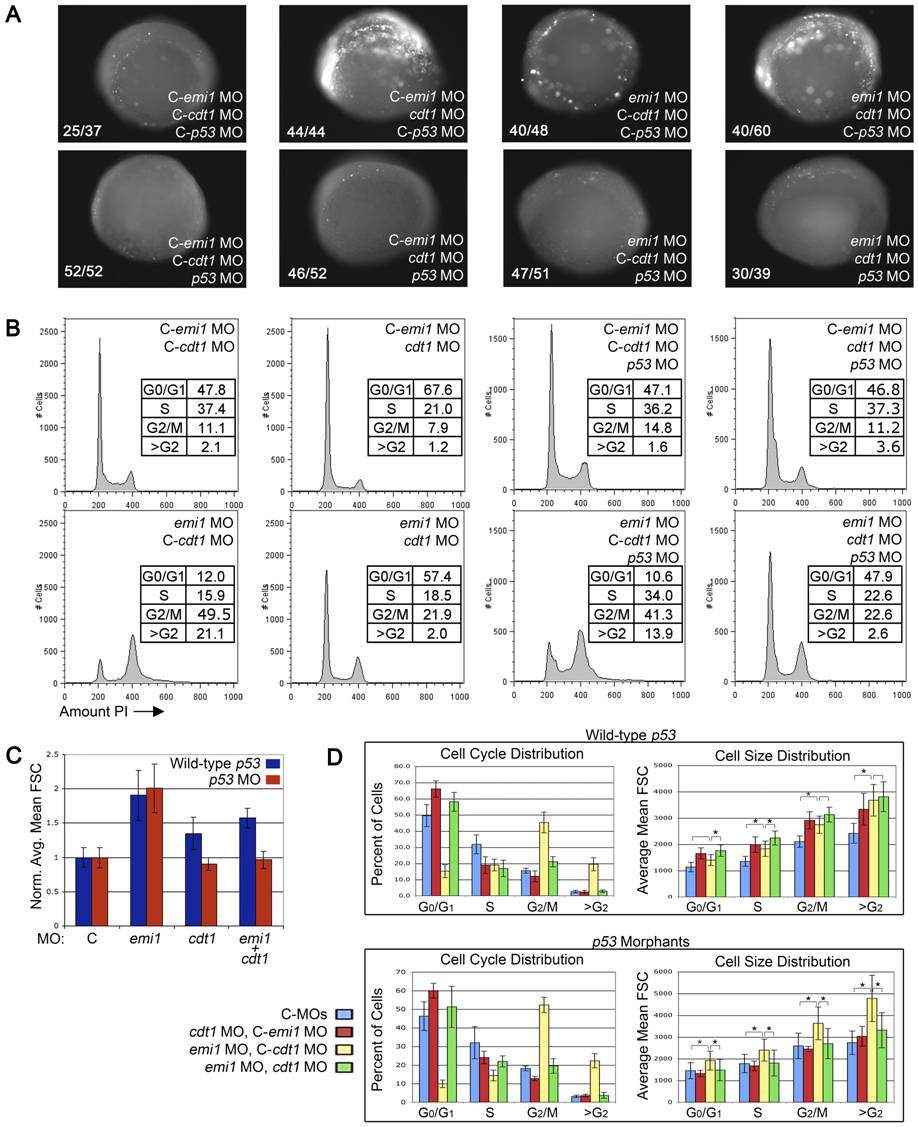
Fig. 3 Knockdown of cdt1 partially ablates rereplication and increased cell size in emi1 morphants.
(A) Cell death assay in 4–5 somite embryos injected with the indicated morpholinos. C- indicates the mismatch control morpholino for the indicated gene. We injected 2 ng emi1 MO or C-emi1 MO, 2.7 ng cdt1 MO or C-cdt1 MO, 7 ng p53 MO or C-p53 MO per embryo from a cocktail mix. Cell death was detected by immunoflurescence staining of activated Caspase 3. Note the high levels of activated Caspase 3 in cdt1 morphants and cdt1 emi1 double morphants. Co-knockdown of p53 significantly alleviated the cell death in all cases. (B) Representative PI-based cell cycle analysis of total cells from pools of 4–5 somite embryos injected with the indicated morpholinos (same doses as in A). Note that cdt1 morpholino partially, but significantly rescued the cell cycle defects in emi1 morphants. The 4 panels on the right show no significant effect of p53 knockdown on cell cycle distribution in embryos injected with cdt1 or emi1 morpholinos or both. (C) Normalized average cell size based on FACS analysis of total cells from the indicated morphants from 10 independent experiments. We removed the highest and lowest value for each sample and averaged data from 8 experiments. (D) Summary of the cell cycle and cell size distribution at different phases of the cell cycle. Top panels were obtained from p53 wild-type embryos, bottom panels show data from p53 morphant embryos. The legend indicates the morphant populations.

