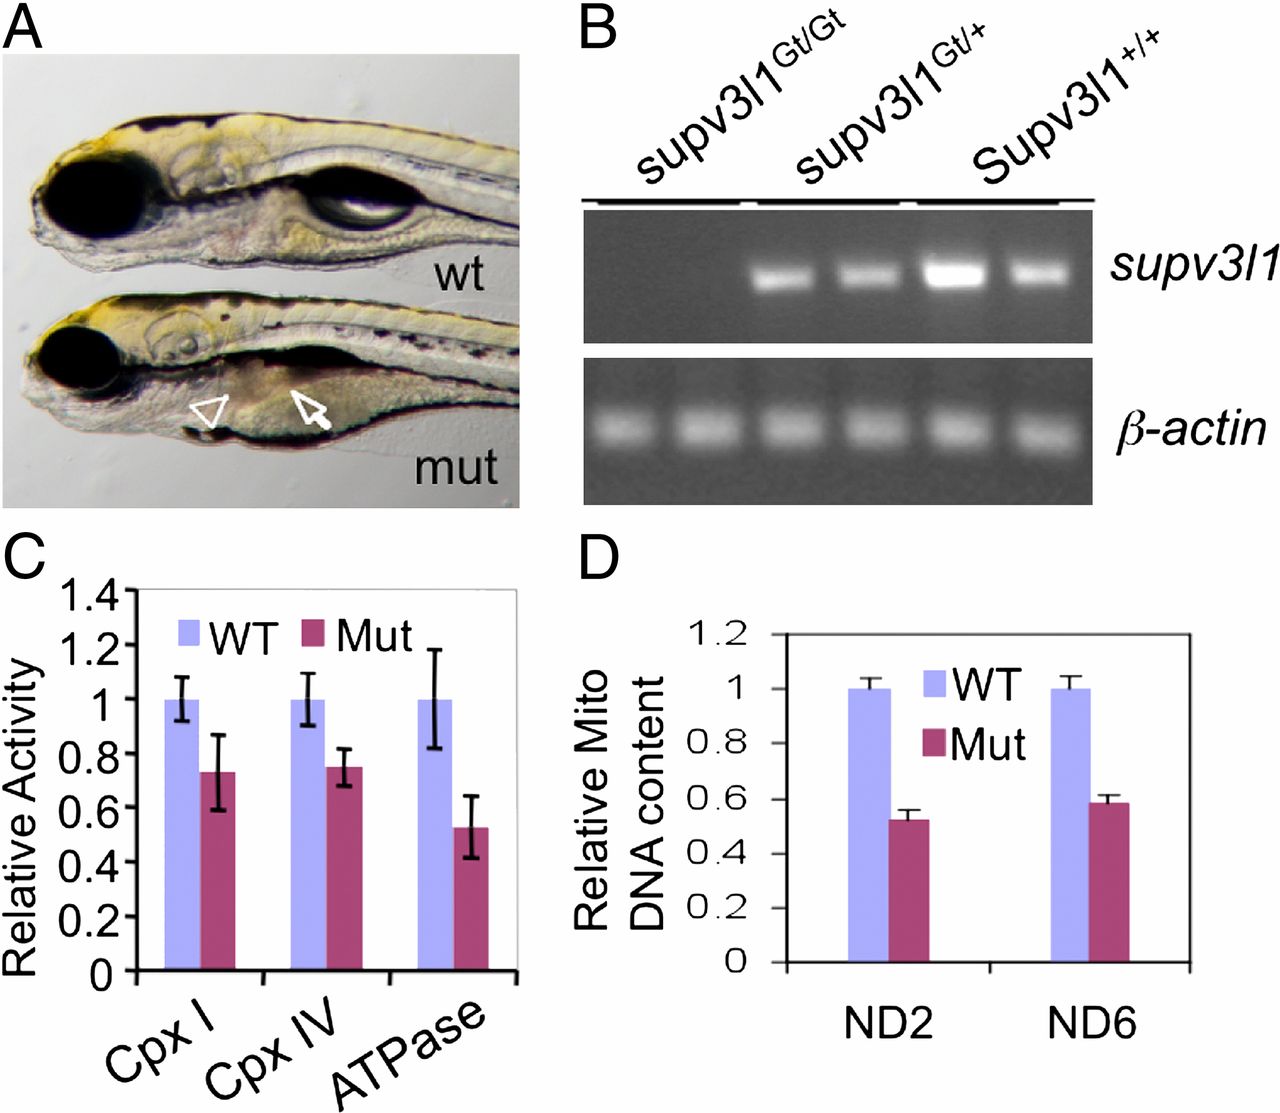
Fig. 3 Phenotypes of supv3l1GtT/GtT mutants. (A) Gross morphological defects at 5 dpf in supv3l1Gt/Gt showing smaller eyes, lack of an inflated swim bladder, small and dark liver (arrowhead), and underdeveloped and dark intestine (arrow). (B) RT-PCR analysis showing undetectable supv3l1 mRNA in the mutant (Upper ) with normal β-actin mRNA levels (Lower). (C) Bar graph (mean ± SE) of whole-animal Western blot analysis of the levels of components of mitochondrial complexes showing a decrease in the levels of NDUFB6 (complex I), CoxVa (complex IV), and F-ATPase (complex V) in the mutants (n = 4). P < 0.05 for complex IV and ATPase. The difference for complex I did not reach statistical significance (P = 0.12). (D) Bar graph (mean ± SEM) showing a decrease in mitochondrial DNA relative to nuclear DNA (β-actin 2) (n = 4). P < 0.05 for both ND2 and ND6. n = 4.
Image
Figure Caption
Figure Data
Acknowledgments
This image is the copyrighted work of the attributed author or publisher, and
ZFIN has permission only to display this image to its users.
Additional permissions should be obtained from the applicable author or publisher of the image.
Full text @ Proc. Natl. Acad. Sci. USA

