Image
Figure Caption
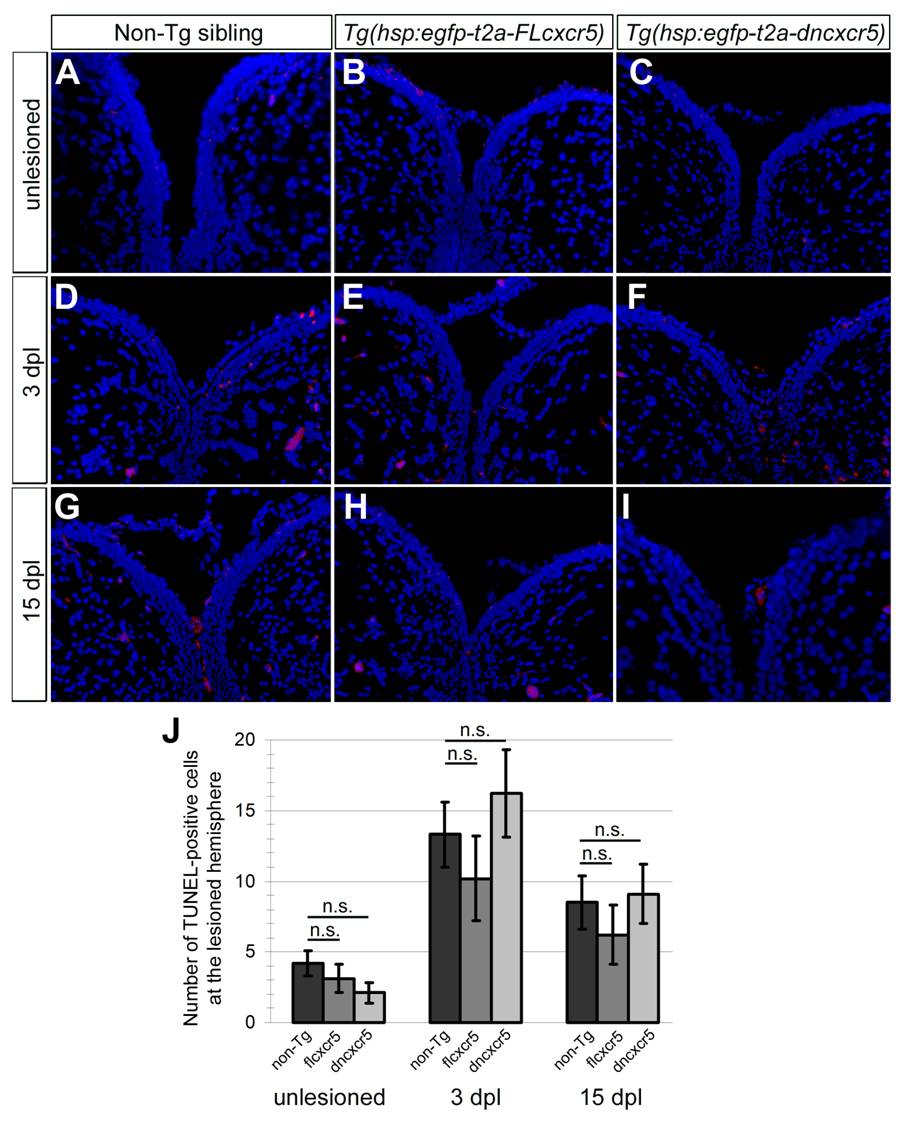
Fig. S6 Misexpression of cxcr5 does not lead to cell death. (A-I) TUNEL staining to detect the apoptotic cells in non-transgenic siblings, Tg(hsp:egfpt2a-FLcxcr5) and Tg(hsp:egfp-t2a-dncxcr5) animals pre-lesion, 3 days post-lesion (dpl) and 15 dpl time points. Red nuclei indicate the apoptotic cells. (J) Quantification graph shows the number of apoptotic nuclei in the lesioned hemisphere. Misexpression of cxcr5 does not alter the levels of cell death. Two telencephalons were used for every time point.
Acknowledgments
This image is the copyrighted work of the attributed author or publisher, and
ZFIN has permission only to display this image to its users.
Additional permissions should be obtained from the applicable author or publisher of the image.
Full text @ Neural Dev.

