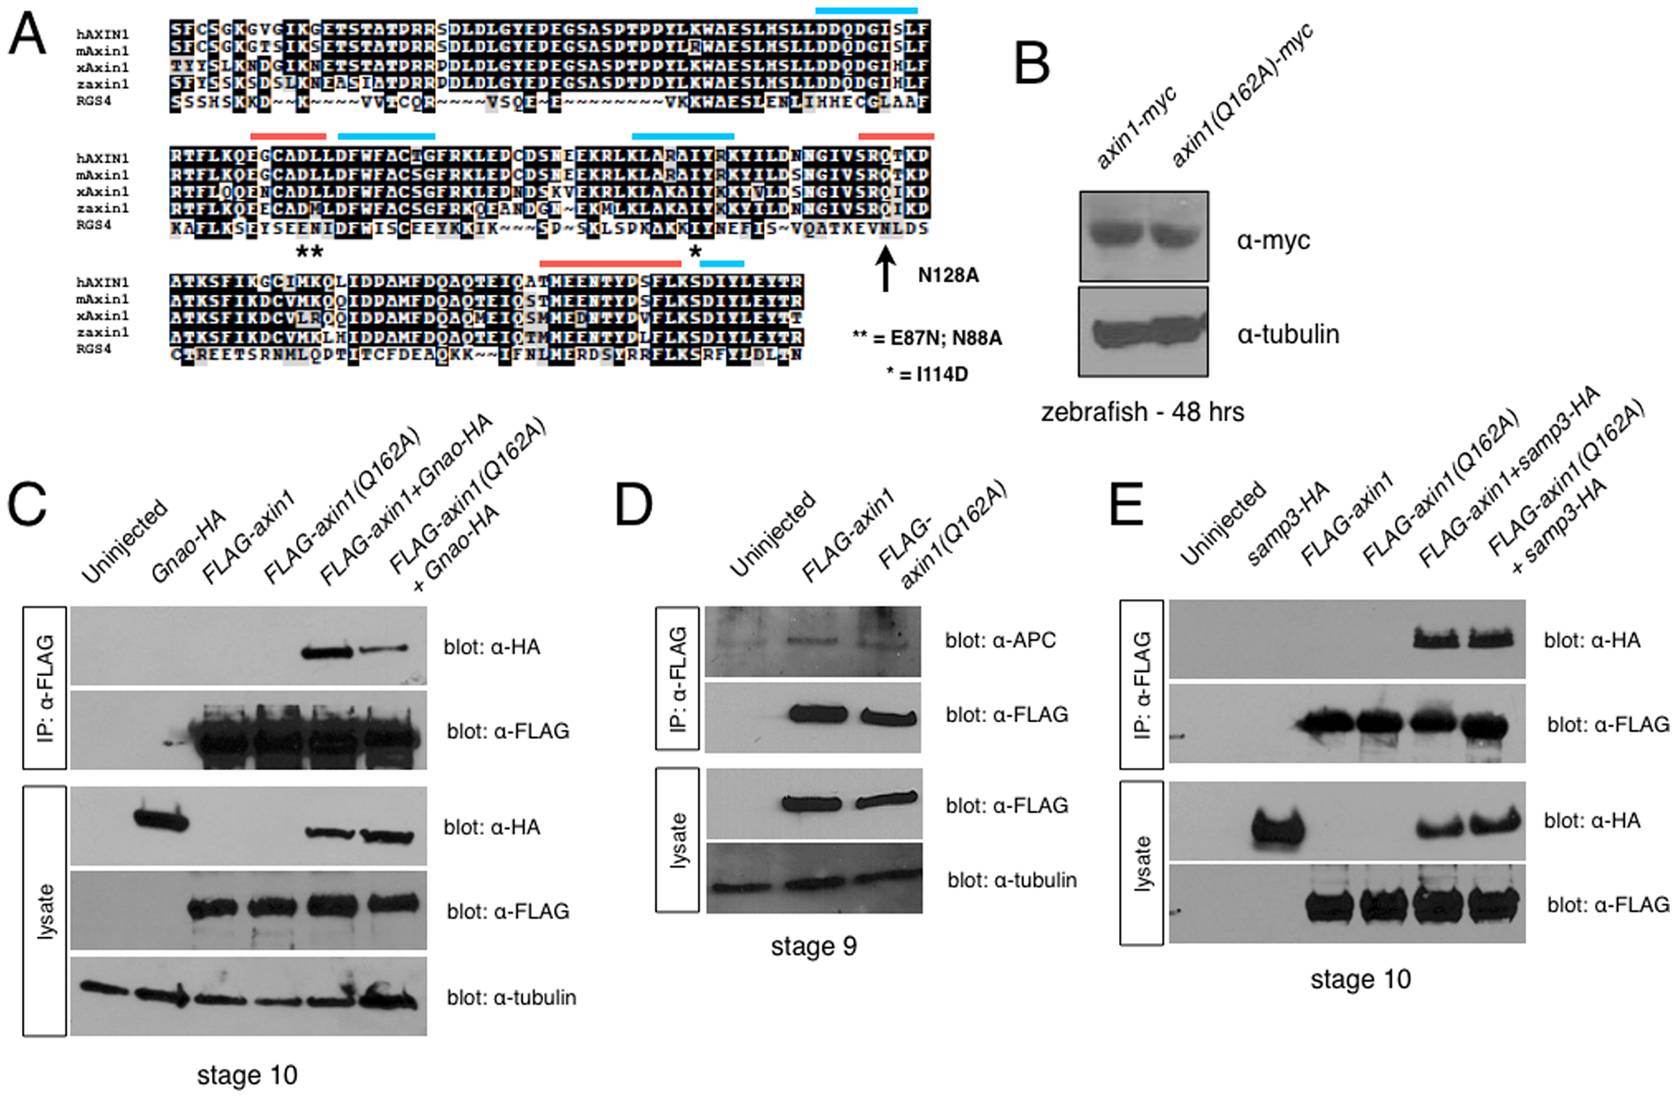
Fig. 1 Structure-function analysis of the Axin1 RGS domain.
(A) Alignment of RGS domains from human (hAXIN1), mouse (mAxin1), Xenopus (xAxin1) and zebrafish Axin1 (zAxin1) with human RGS4. Blue bars = APC binding interface; orange bars = Gna binding interface. * = residues required for GAP activity in RGS4. Arrow = residue required for RGS4 GAP activity, mutated in this study. (B) Immunoblots showing equivalent protein expression in 24 hpf zebrafish embryos injected with axin1-myc and axin1(Q162A)-myc. (C) Immunoprecipitation of FLAG-tagged Axin1 constructs with HA-tagged Gnao, showing reduced binding of FLAG-Axin1(Q162A) to overexpressed Gnao. (D) FLAG-Axin1 and FLAG-Axin1(Q162A) immunoprecipitate endogenous APC equivalently. (E) FLAG-Axin1 and FLAG-Axin1(Q162A) immunoprecipitate HA-tagged APC-SAMP3 equivalently.

