
Image
|
Figure Caption
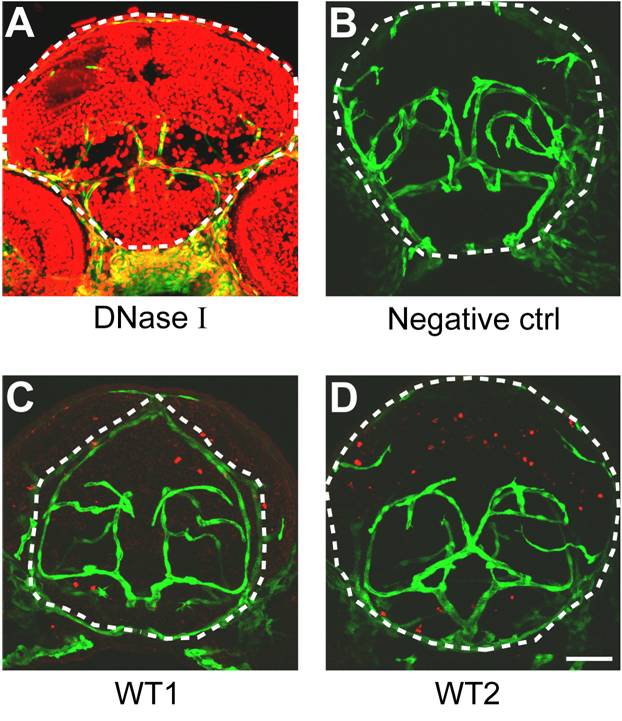
Fig. S14 TUNEL staining of developing zebrafish midbrain. (A) TUNEL staining of DNase I-treated Tg(kdrl:eGFP) zebrafish brain at 3 dpf. DNase I treatment generates strand breaks in the DNA to provide a positive TUNEL reaction. Red, TUNEL signal. The dashed white line delineates the outline of midbrain. (B) Staining of Tg(kdrl:eGFP) zebrafish larva brain without terminal transferase, serving as a negative control. (C and D) Two examples of TUNEL staining of Tg(kdrl:eGFP) zebrafish brain (WT1, WT2) at 3 dpf. Scale, 50 μm.
Acknowledgments
This image is the copyrighted work of the attributed author or publisher, and
ZFIN has permission only to display this image to its users.
Additional permissions should be obtained from the applicable author or publisher of the image.
Full text @ PLoS Biol.