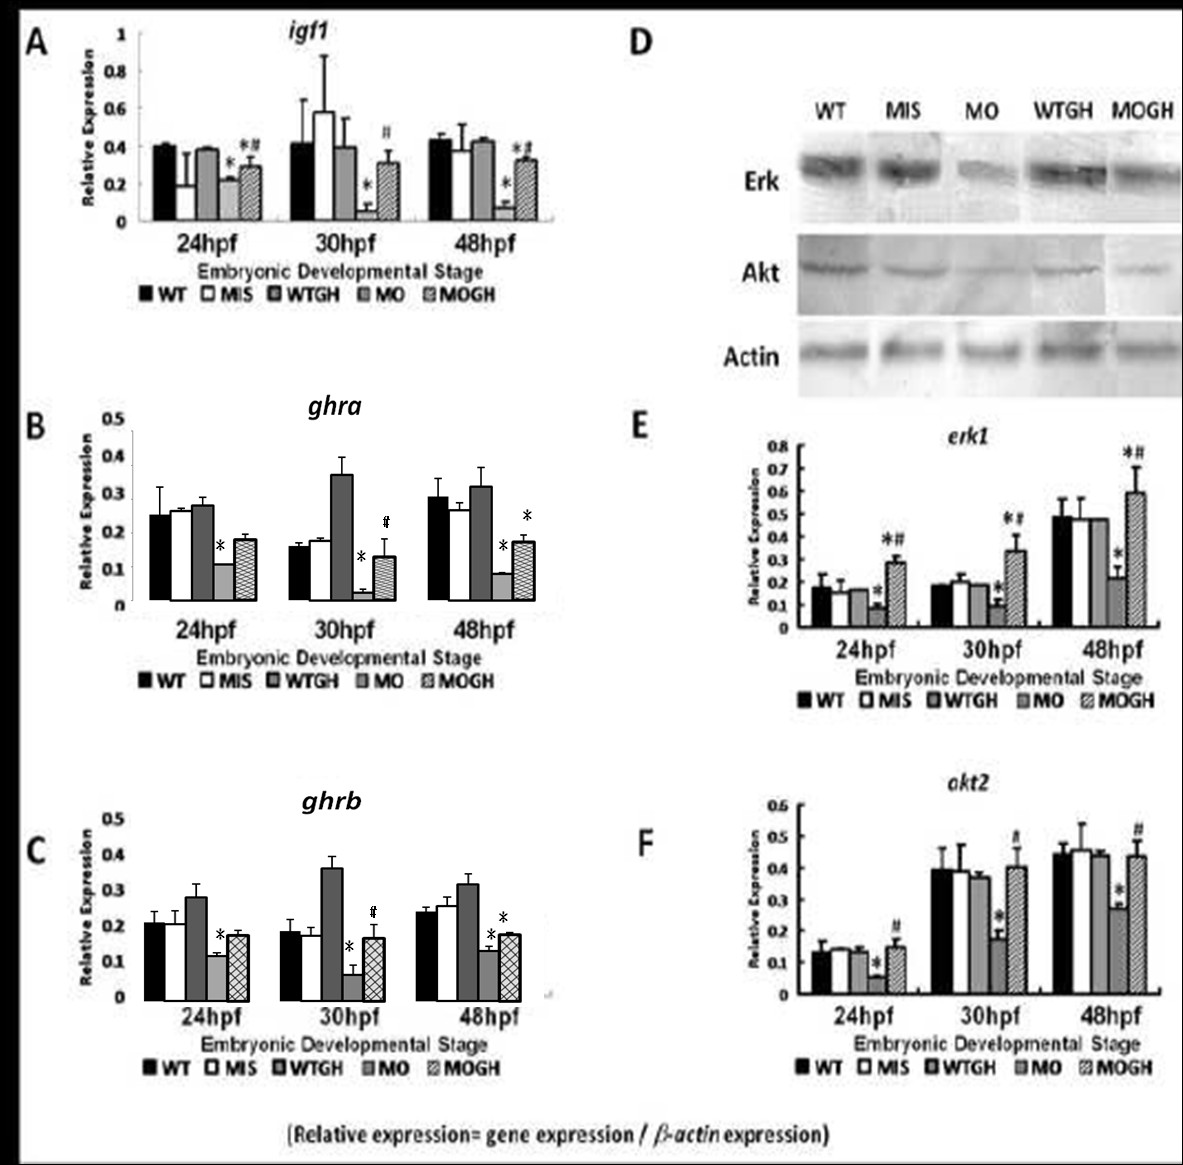
Fig. 2 Expressions ofigf1, ghra, ghrb, akt2,and erk1 in tbx5 knockdown embryos. (A) The expression of igf1 was significantly reduced in MO group embryos throughout the developmental stages. Its expression in WTGH and MIS embryos was similar to the control and wild-type (WT) groups. The expression of igf1 was significantly restored in the WTGH treatment group. Expressions of GH receptors ghra (B) and ghrb (C) were significantly depressed in MO embryos but restored in the MOGH treatment group. (D) In the Western blot analysis, protein expressions of Akt and Erk in MO zebrafish embryos were depressed, but expressions were similar among the WT, MIS, and WTGH groups at 30 h post-fertilization (hpf). Expressions of Akt and Erk were restored in the MOGH group. In the semiquantitative PCR analysis, mRNA expressions of erk1 (E) and akt2 (F) were significantly reduced in MO group embryos and restored in the MOGH group. Data are presented as the mean ± S.D. *p < 0.05 vs. WT; #p < 0.05 MOGH vs. MO. MO, tbx5 knockdown; MIS, mismatched tbx5-MO-treated embryos; WTGH, WT embryos treated with growth hormone (GH); MOGH, tbx5-MO- and GH-treated embryos.
Image
Figure Caption
Figure Data
Acknowledgments
This image is the copyrighted work of the attributed author or publisher, and
ZFIN has permission only to display this image to its users.
Additional permissions should be obtained from the applicable author or publisher of the image.
Full text @ J. Biomed. Sci.

