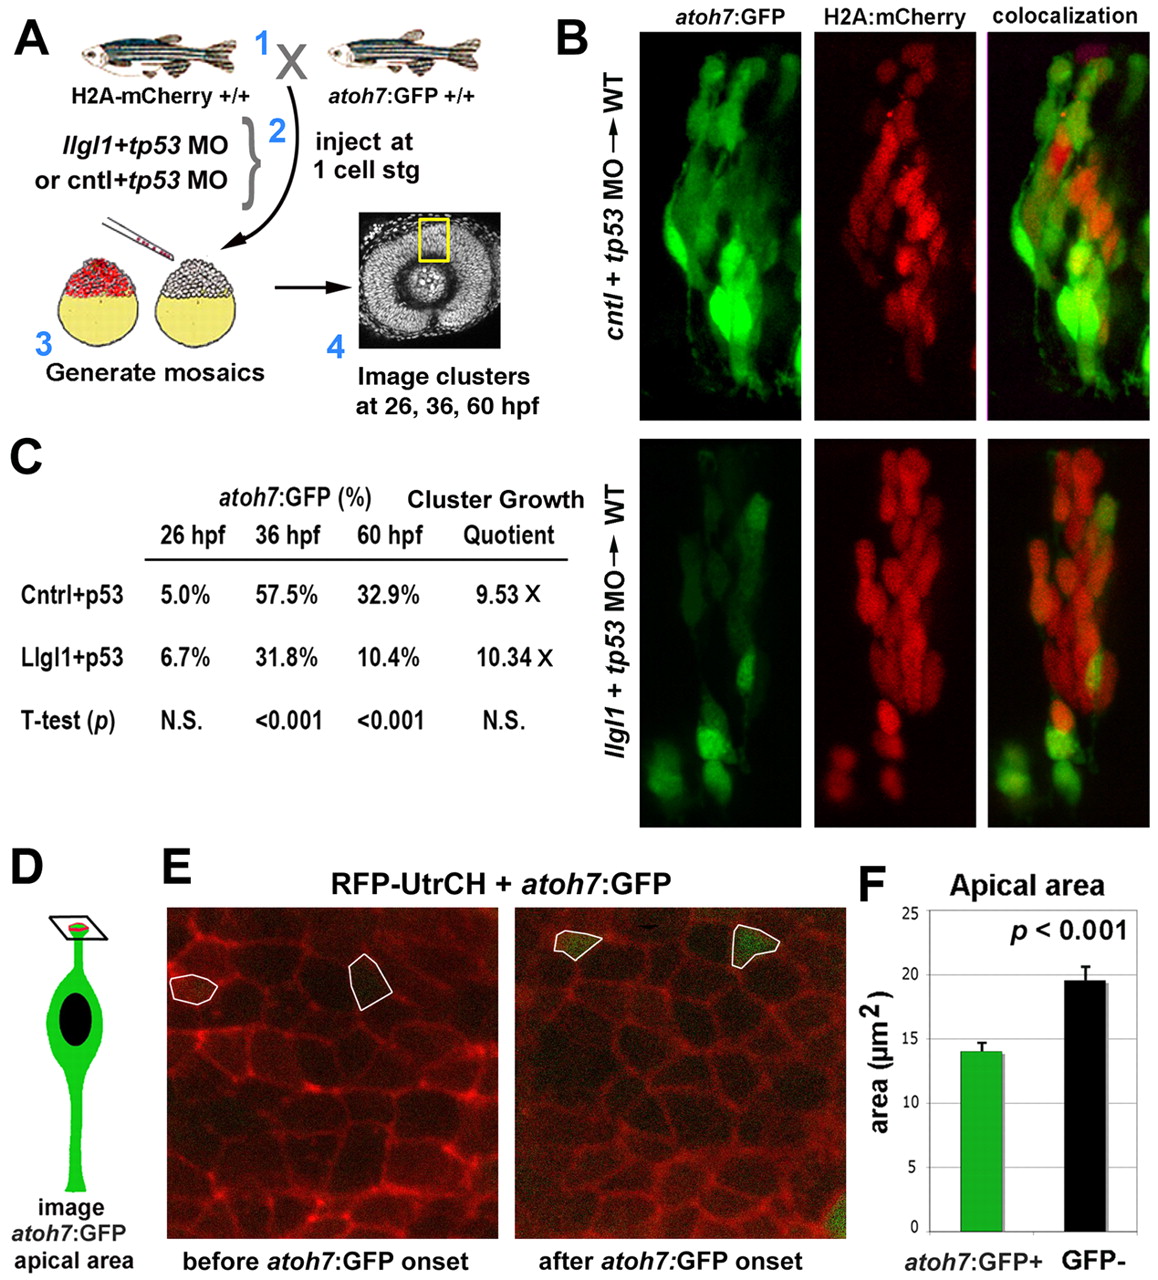
Fig. 5 Neurogenesis is reduced in Llgl1-deficient retinal neuroepithelia. (A) Experimental design for evaluating neurogenesis in morphant retinal cells in wild-type host eyes. (B) Confocal images of donor cells showing atoh7:GFP (green, left panels), H2A-mCherry (red, middle panels) and combined images (right panels) at 36 hpf. Donor cells were derived from embryos injected with either 8 ng control+ 8ng tp53 MO (top) or 8 ng tp53 + 8ng llgl1 ATG MO (bottom). (C) Comparison of the proportion of atoh7:GFP-positive cells in control or llgl1 morphant clusters (n>10 clusters from 10 chimeras for each condition) tracked at 26, 36 and 60 hpf. Cluster Growth Quotient indicates the fold expansion of the cluster cell number [(60 hpf cell number?26 hpf cell number)/26 hpf cell number]. (D) Image plane used to measure apical area. (E) Confocal images of retinal neuroepithelial apical domains prior to atoh7:GFP expression (segmented areas, left) and just after GFP became detectable (right). Apical junctions are labeled by injection of RFP-UtrCH mRNA (red) (F) Comparison of the apical area of cells prior to atoh7:GFP (green bars, n=21 cells) expression and cells that did not go on to express GFP (black bars, n=35 cells). Error bars represent s.e.m.; P, Student?s t-test.
Image
Figure Caption
Acknowledgments
This image is the copyrighted work of the attributed author or publisher, and
ZFIN has permission only to display this image to its users.
Additional permissions should be obtained from the applicable author or publisher of the image.
Full text @ Development

