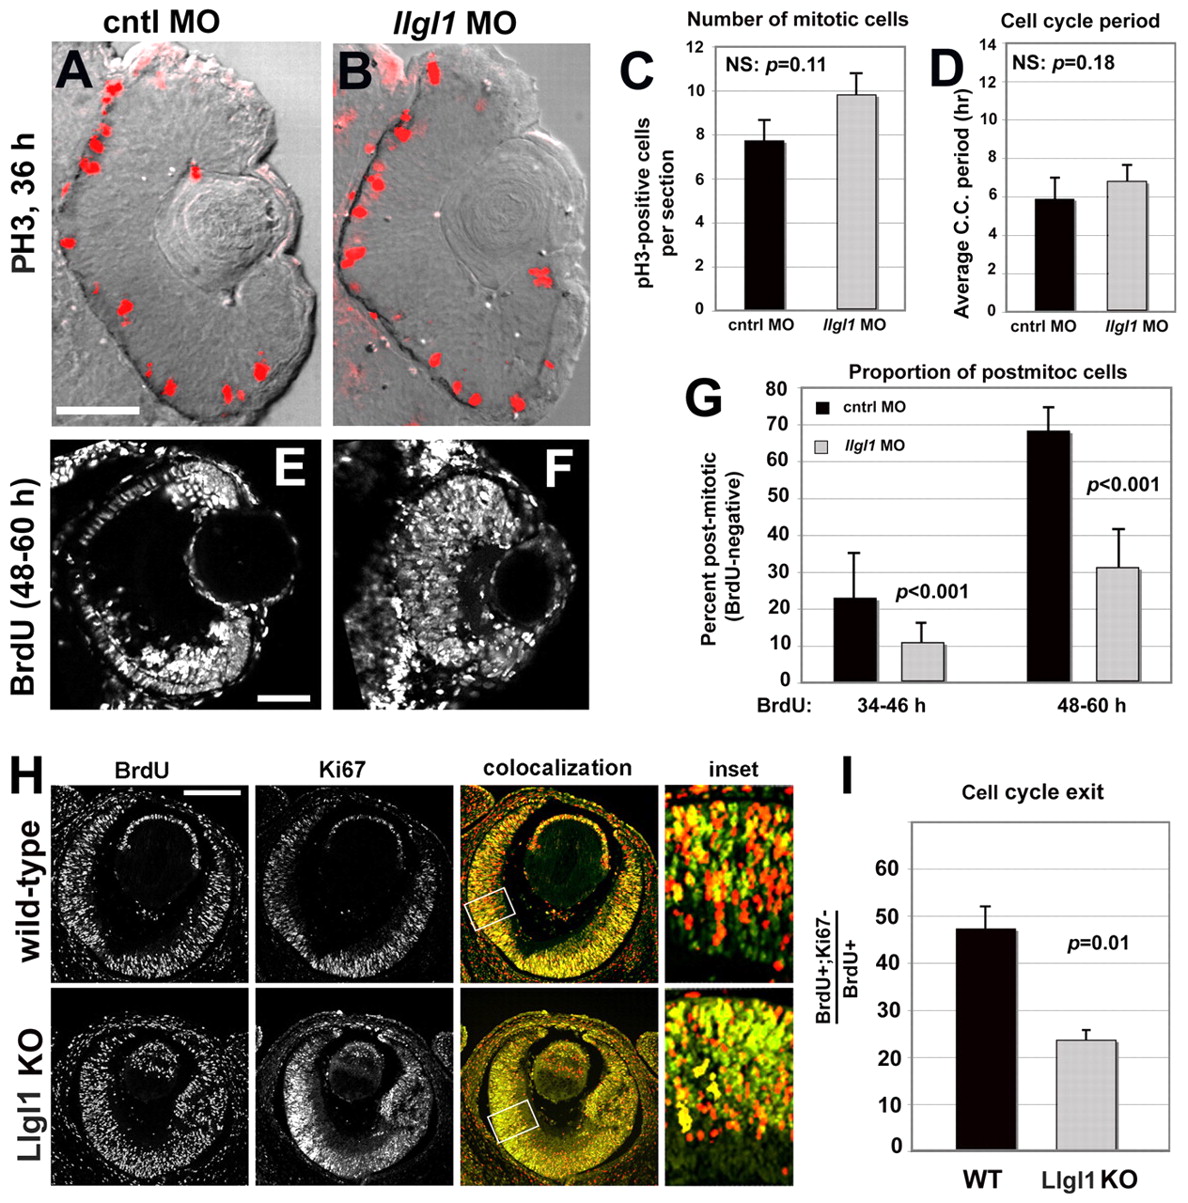
Fig. 2 Loss of Llgl1 disrupts cell cycle exit in retinal progenitor cells. (A,B) Phosphohistone3 (PH3) immunoreactivity in zebrafish eyes of 36 hpf (A) wild-type and (B) llgl1 MO (8 ng) embryos. (C) Comparison of the number of PH3-positive mitotic cells between control (black bar) and llgl1 morphant (gray bar) zebrafish embryos (n=12 eyes analyzed for each condition). (D) Comparison of the cell cycle period between control (black bar) and llgl1 morphant (gray bar) zebrafish embryos (n=25 cells each from four control MO or five llgl1 MO embryos). (E,F) Retinal sections from 60 hpf wild-type (E) or llgl1 morphant (F) zebrafish showing BrdU labeling starting at 48 hpf. (G) Comparison of the proportion of BrdU-negative (post-mitotic cells) per section between control (black bars) and llgl1 morphant (gray bars) zebrafish embryos (n=10 retina analyzed for each condition). BrdU was injected from 34-46 hpf (left) or from 48-60 hpf (right). (H) BrdU labeling [red (E14.5-E15.5)] and Ki67 (green) immunoreactivity with colocalization (yellow) and high-magnification inset for wild-type and Llgl1 homozygous mutant mice. (I) Comparison between wild-type (black bar) and Llgl1 homozygous mutant mice (gray bar) for the percentage of retinal cells that had exited the cell cycle between E14.5 and E15.5 (proportion of BrdU-positive; Ki67-negative of the total number of BrdU-positive cells). For each genotype, six eyes from three embryos were quantified. For C,D,G,I, error bars represent s.e.m.; P, Student?s t-test; NS, not significant. Scale bars: 100 μm in A,B,H; 50 μm in E,F.
Image
Figure Caption
Figure Data
Acknowledgments
This image is the copyrighted work of the attributed author or publisher, and
ZFIN has permission only to display this image to its users.
Additional permissions should be obtained from the applicable author or publisher of the image.
Full text @ Development

