
|
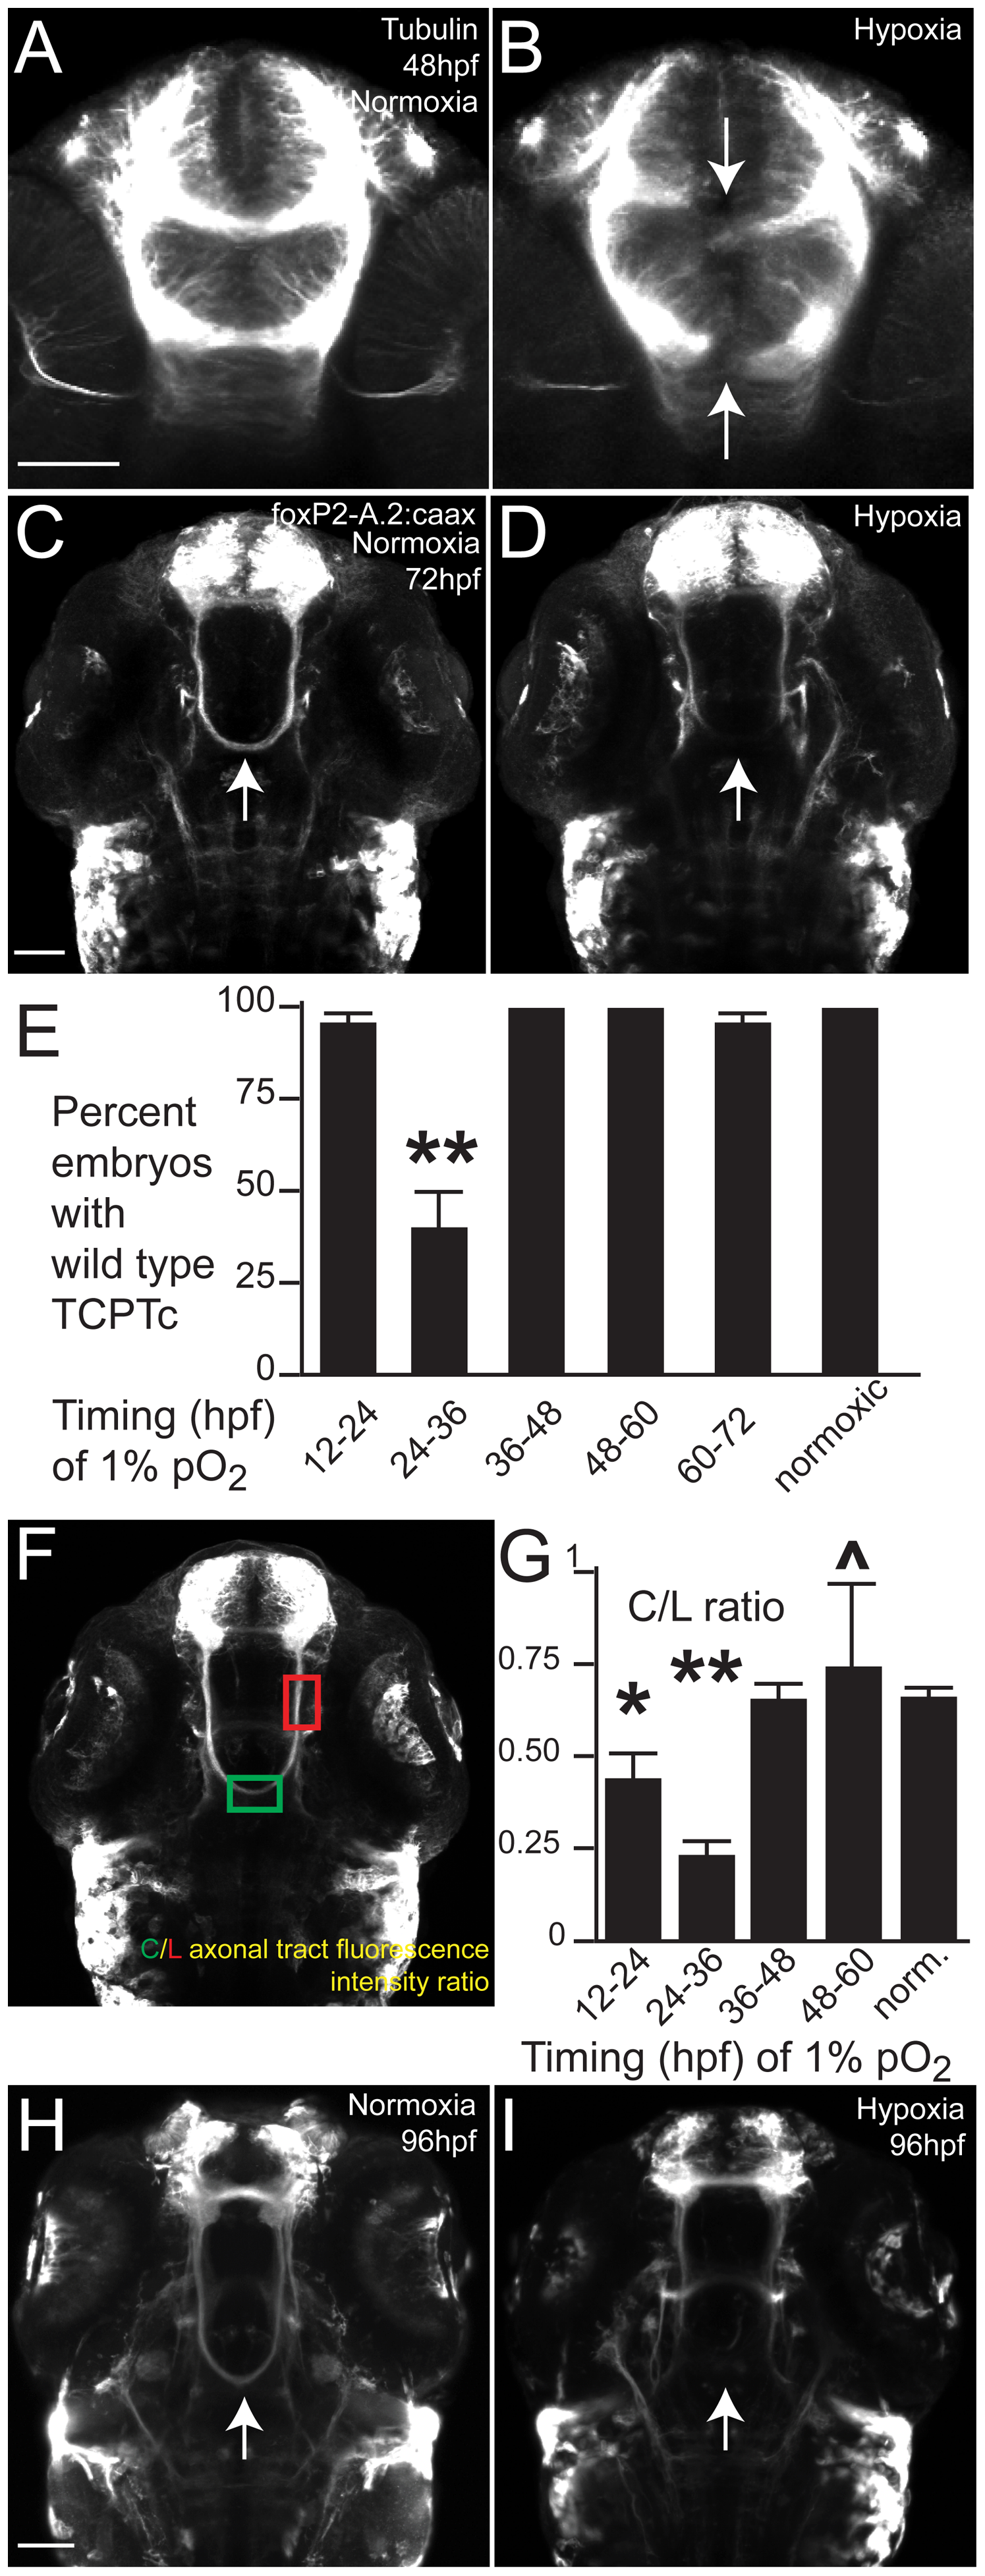
Fig. 1
Hypoxia disrupts axon pathfinding in the developing CNS.
Confocal images are maximum intensity projections of whole-mount embryos, ventral views, rostral top, scale bars 50 μm. (A, B) 48 hpf embryos, acetylated tubulin immunohistochemistry. (B) Following 1% hypoxia (1% pO2) from 24–36 hpf, anterior commissure and post-optic commissural tracts are disrupted (arrows). (C–I) Tg(foxP2-enhancerA.2:egfp-caax) embryos (abbreviated foxP2-A.2:caax), GFP immunohistochemistry. (C) Normoxic embryo at 72 hpf; TCPT commissure (TCPTc) (arrow). (D) Embryo following hypoxia from 24–36 hpf; TCPTc is absent (arrow). (E) Graph showing percent Tg(foxP2-A.2:caax) embryos with wild-type TCPTc following hypoxia exposure at different ages. Error bars standard error of the proportion; ** p<0.0001. (F) C/L ratio determination. Confocal image of 72 hpf embryos illustrating determination of ratio of commissure intensity to intensity of longitudinal axons. (G) Quantification of TCPTc errors in Tg(foxP2-A.2:caax) embryos following hypoxia exposure at different ages. C/L (commissure:longitudinal) intensity ratio quantification along y-axis. *p<0.05; ** p<0.0001. ^mark indicates significant mortality at this stage. Errors bars standard error of the mean. (H) Normoxic embryo at 96 hpf; TCPT is intact (arrow). (I) Embryo at 96 hpf following 1% hypoxia from 24–36 hpf; TCPTc is absent (arrow).