Fig. 4
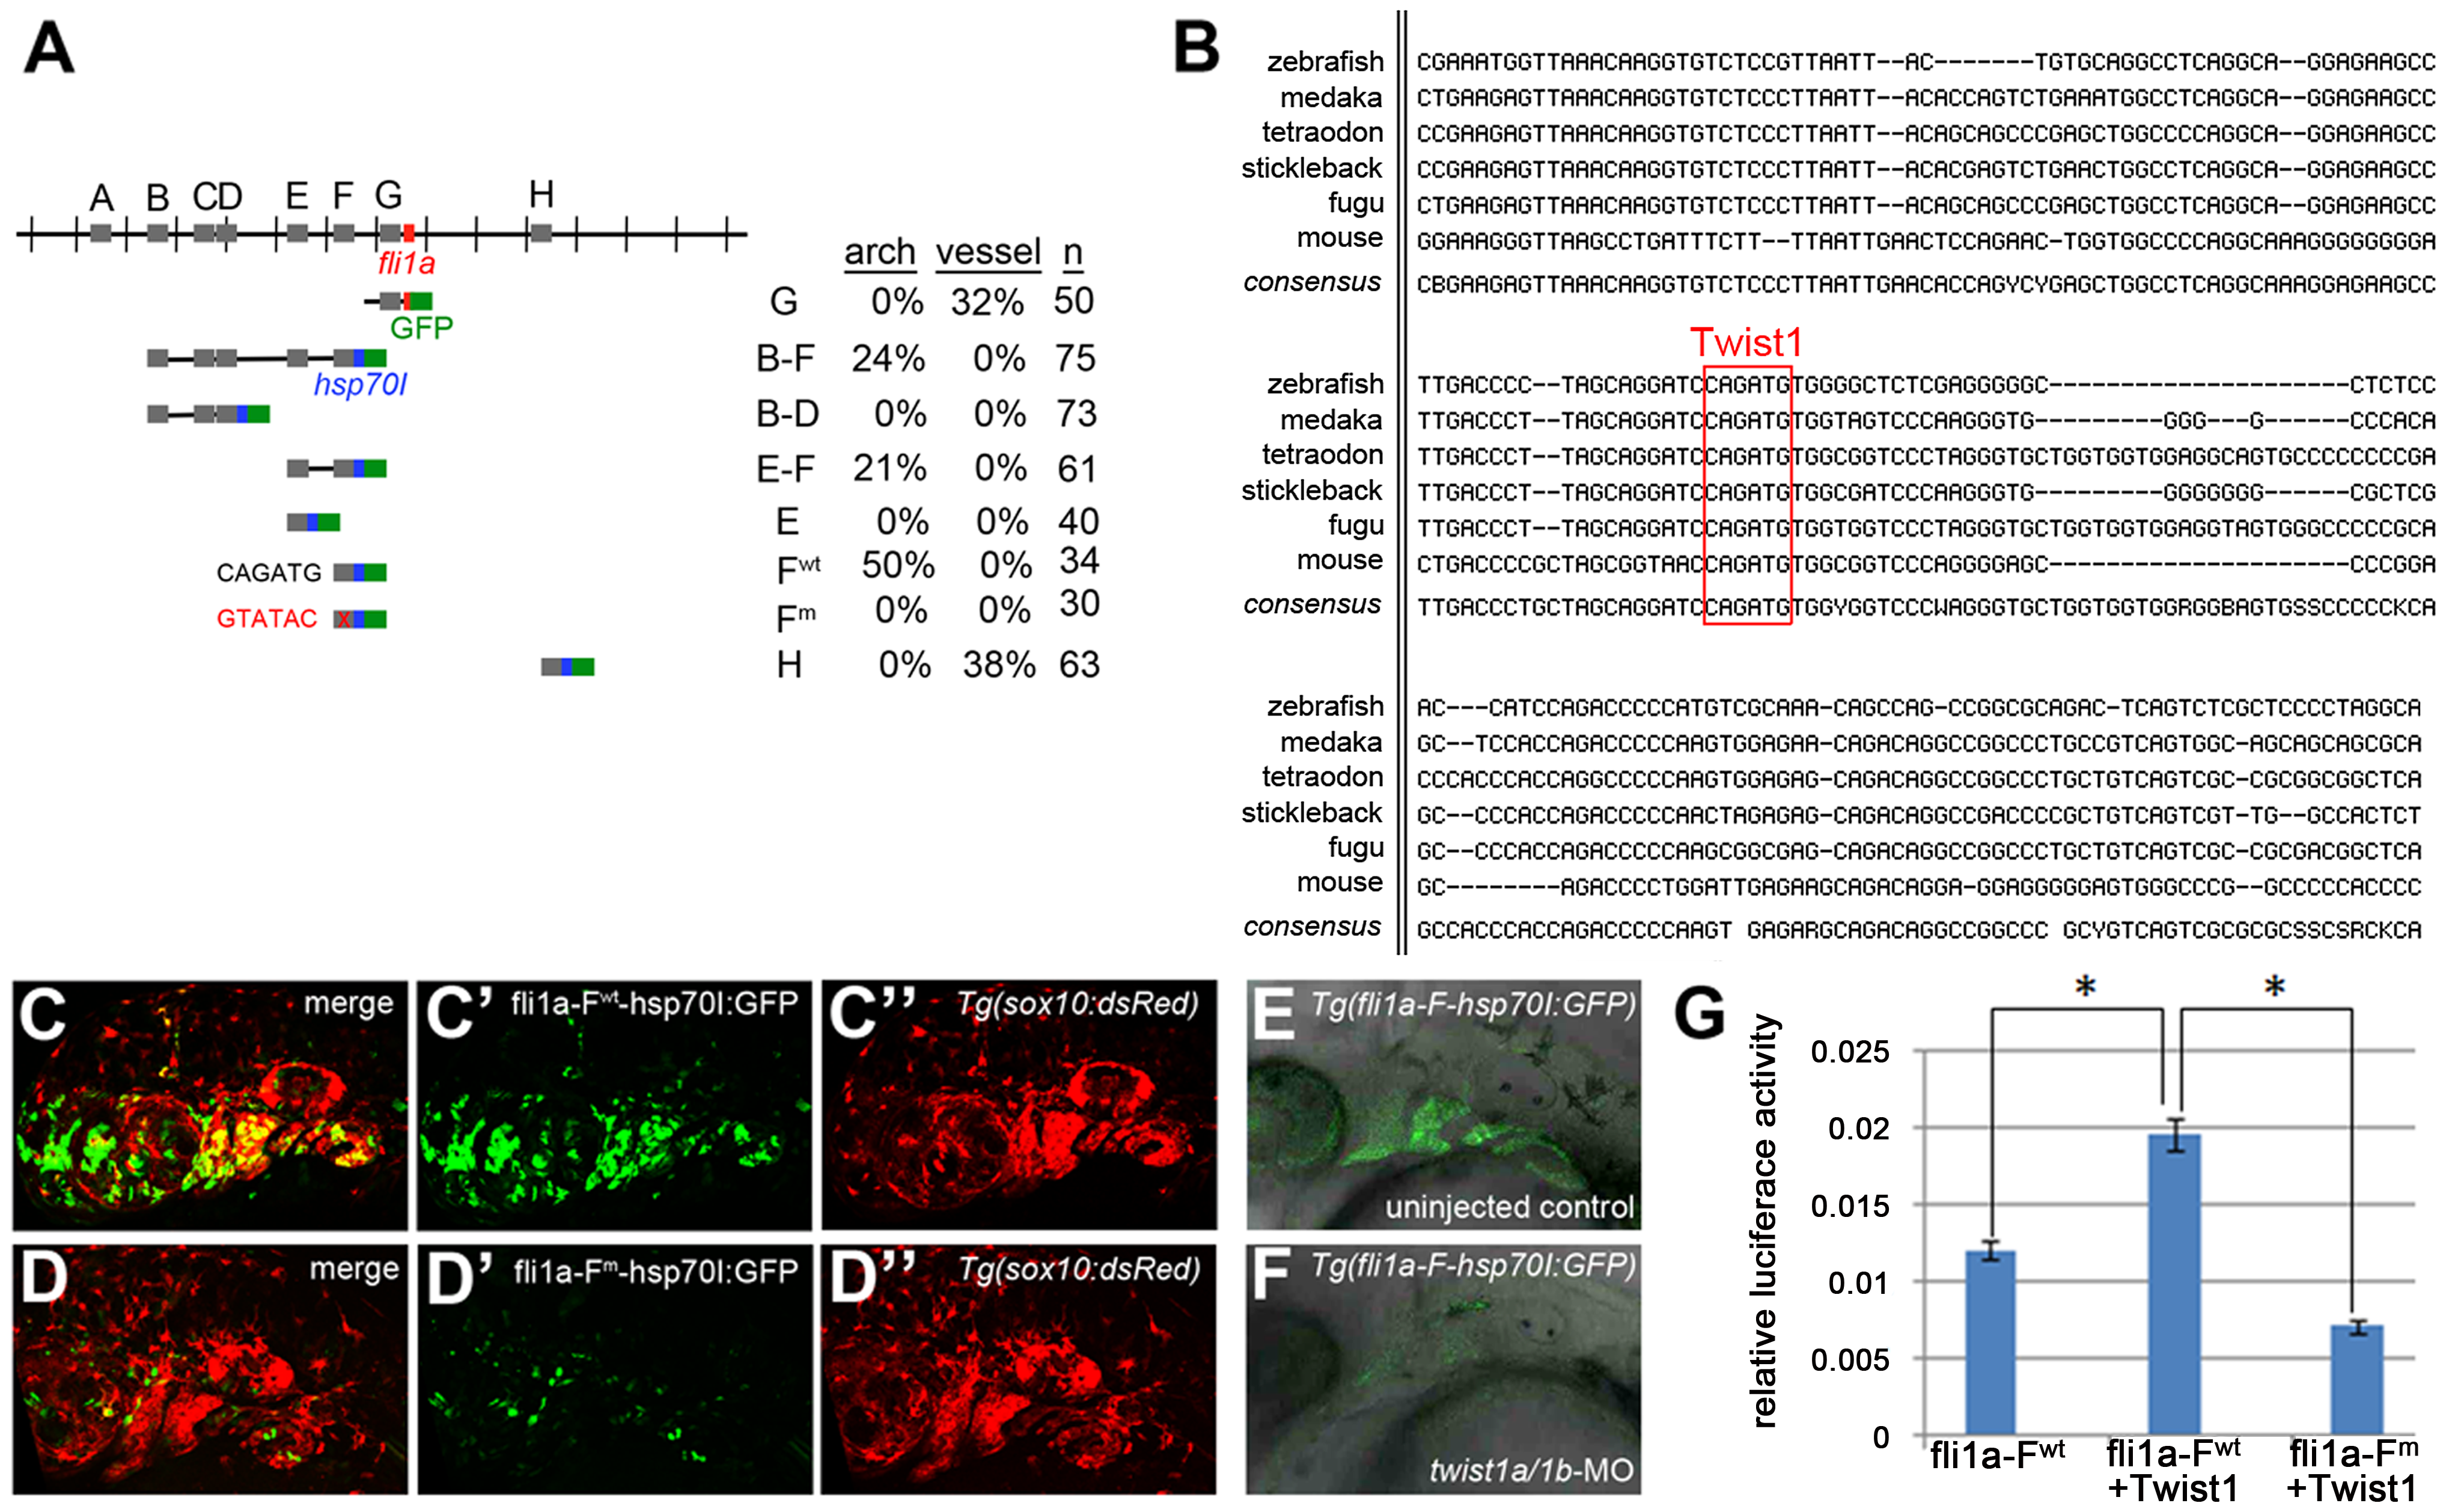
Twist1 regulates fli1a expression through an ectomesenchyme-specific enhancer.
(A) Schematic shows the fli1a genomic locus with hatch marks at 1 kb intervals. Predicted enhancers (grey boxes, ?A?H?) and the first exon (red box) are shown. Below are the various enhancer constructs analyzed, with the hsp70I core promoter in blue and GFP in green. Wild-type (black) and mutant (red) versions of the putative Twist1 binding site are also shown, as is the percentage of transient transgenic embryos showing GFP expression in the pharyngeal arches or vasculature. (B) Alignment of the central portion of the F enhancer between five fish species and mouse. The putative bHLH/Twist1 binding site is boxed in red. (C,D) Confocal projections of 32 hpf sox10:dsRed embryos injected at the one-cell-stage with fli1a-F enhancer constructs. The wild-type (C) but not mutant (D) enhancer drives arch expression. (E and F) Confocal sections of merged GFP and DIC channels show that a stable Tg(fli1a-F-hsp70I:GFP) line displays arch GFP expression in 32 hpf wild-type (E) but not twist1a/1b-MO (F) embryos. (G) Luciferase activity relative to renilla firefly activity in 293T cells transfected with wild-type or mutant fli1a-F enhancer reporter constructs, with or without a Twist1 expression plasmid. Asterisks indicate significant comparisons using a student′s t-test (p<0.05). Arbitrary units and standard error of the mean are shown.

