
|
Fig. S10
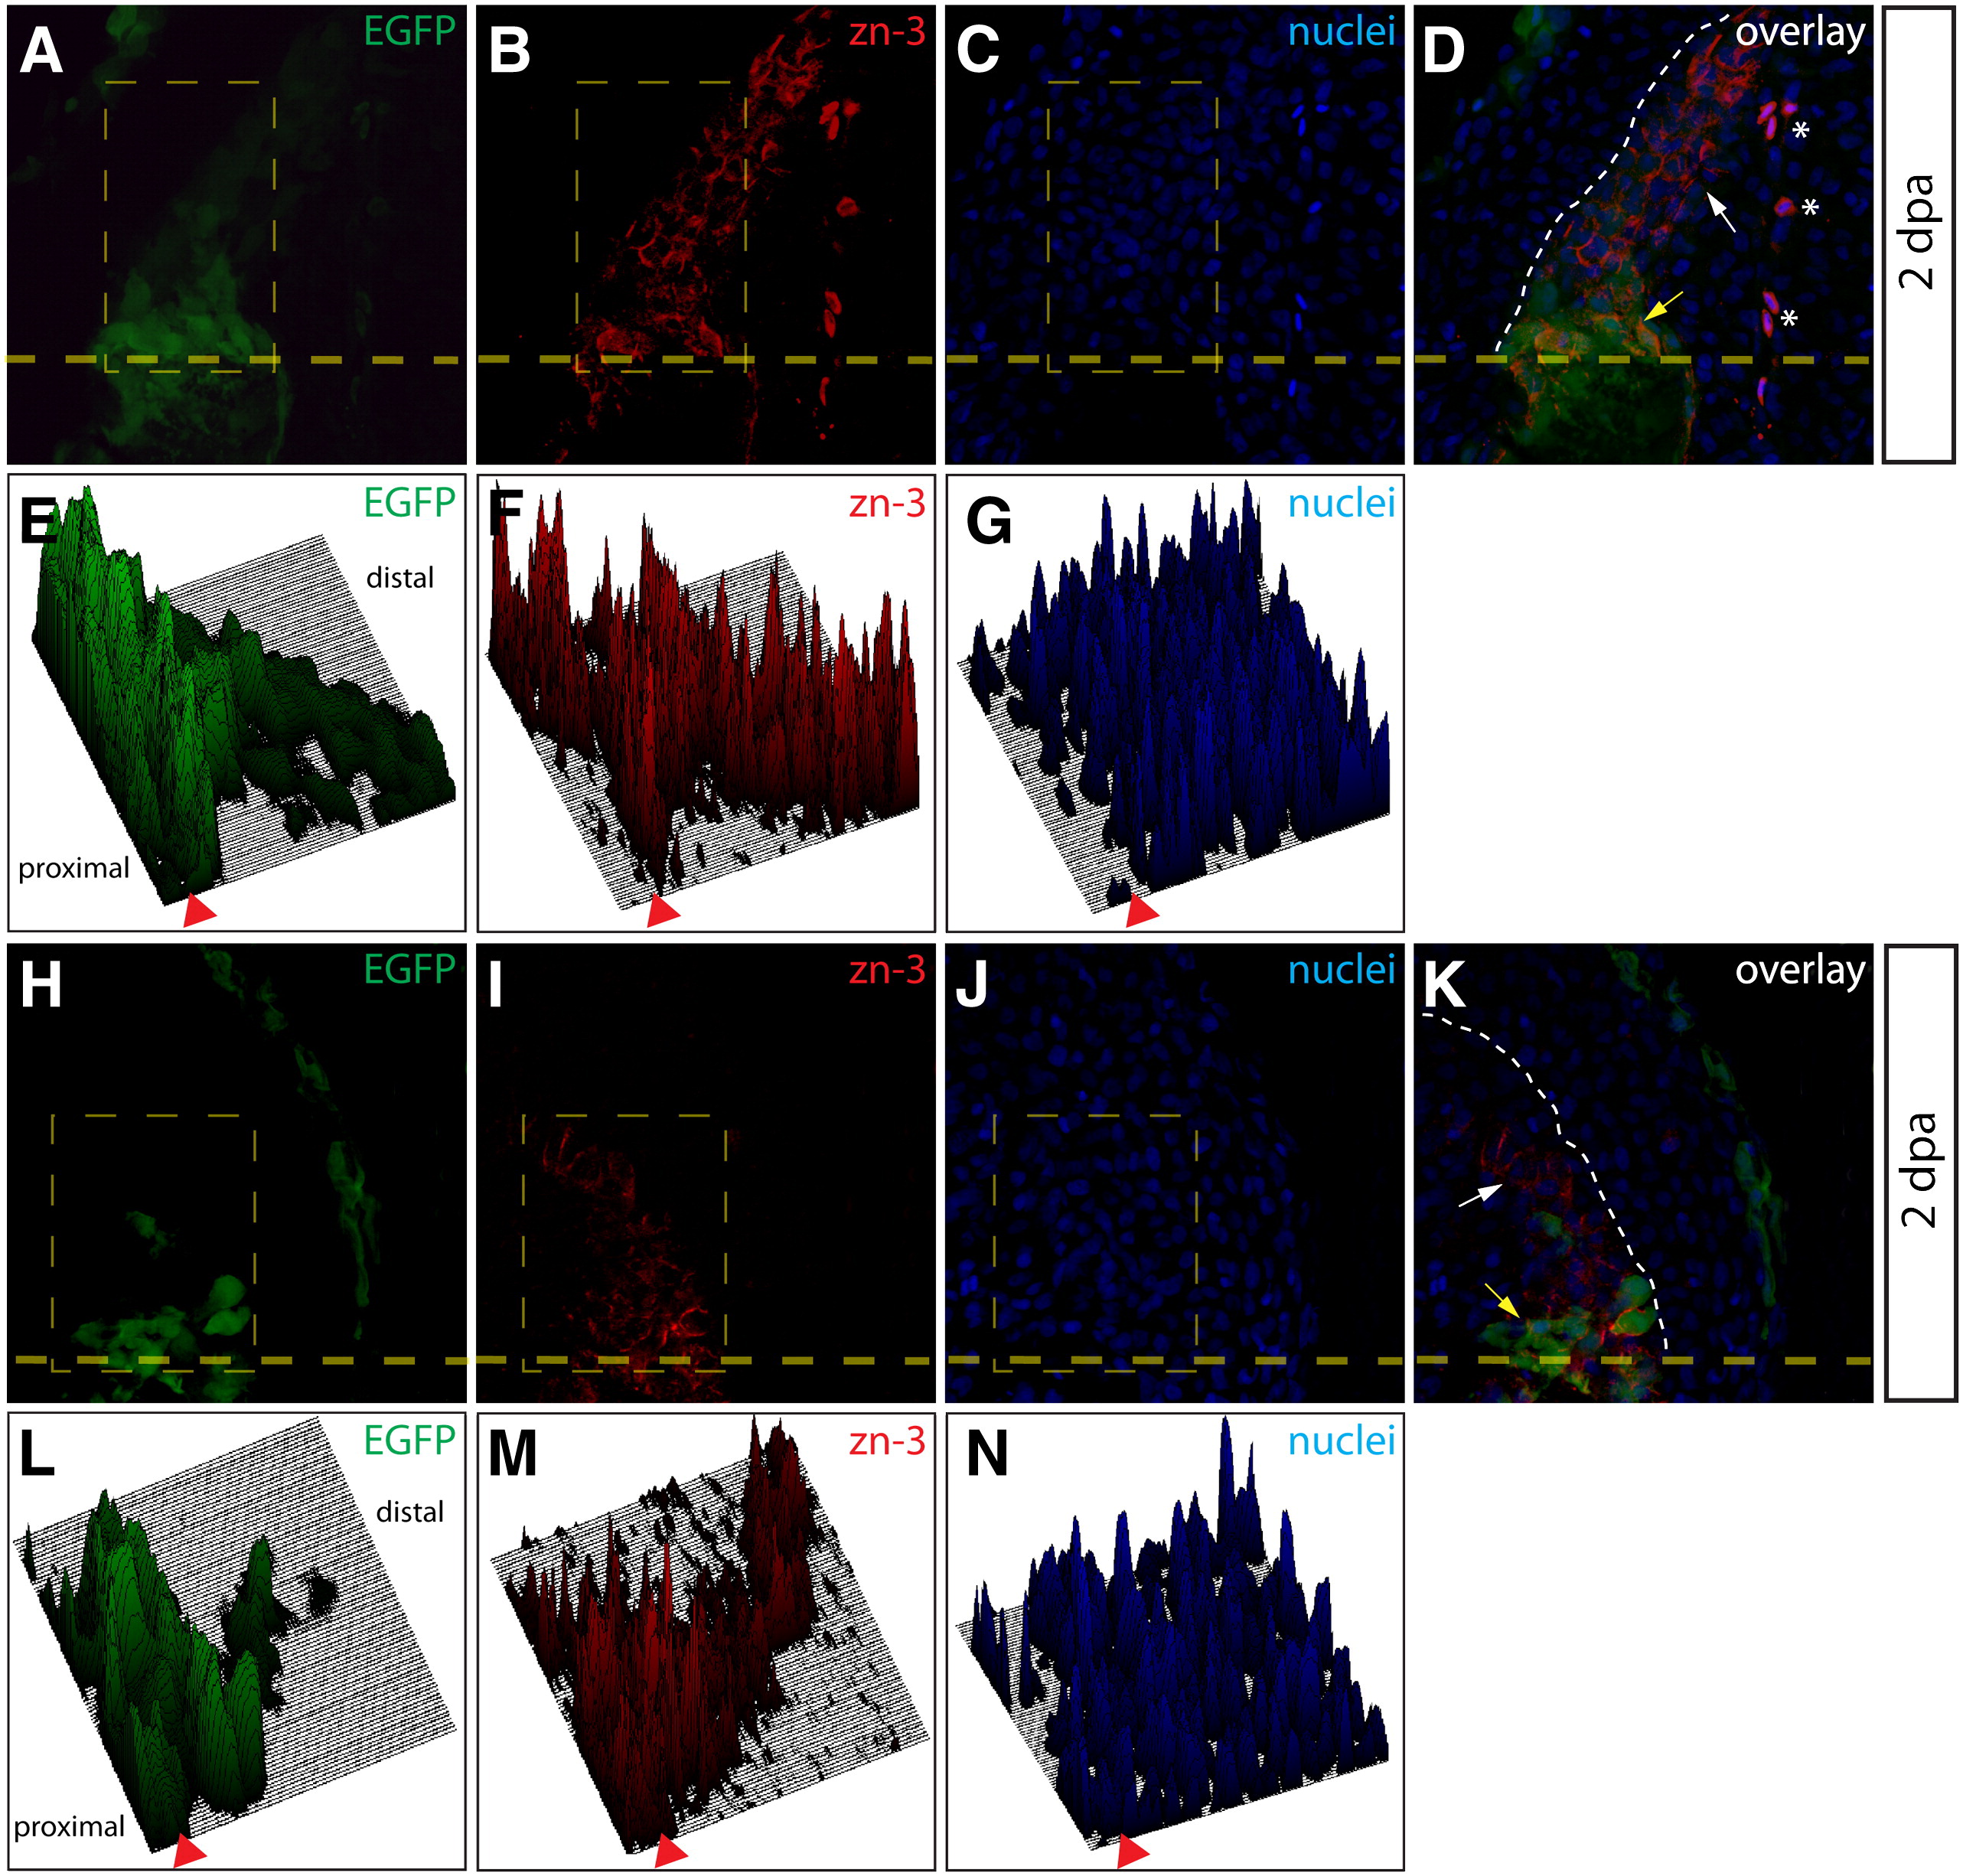
Additional evidence for dedifferentiation of osteoblast-derived cells populating the blastema. (A?D, H?K) Sections from two Tg(sp7:EGFP) animals 2 dpa imaged for EGFP expression (A, H, green) and stained with zn-3 antibodies (B, I, red). Nuclei are stained with Hoechst (C, J, blue) and the overlay is shown (D, K). A heavy dashed yellow line indicates the amputation plane and a white dashed line marks the epidermis?blastema boundary. White arrows point to mCherry+/zn-3 immature, dedifferentiated osteoblasts and the yellow arrows indicate mCherry+/zn-3+ mature, differentiated osteoblasts. Asterisks mark background-staining red blood cells. (E?G, L?N) Fluorescent signal intensities for EGFP (E, L), zn-3 staining (F, M) and Hoechst (G, N) within the indicated rectangle (thin, dashed yellow line in A?C and H?J) are plotted as 3-dimensional surfaces using ImageJ software. The amputation site is marked with an arrowhead and proximal and distal regions relative to the amputation site are indicated.
Reprinted from Developmental Biology, 365(2), Stewart, S., and Stankunas, K., Limited dedifferentiation provides replacement tissue during zebrafish fin regeneration, 339-349, Copyright (2012) with permission from Elsevier. Full text @ Dev. Biol.