
|
Fig. 8
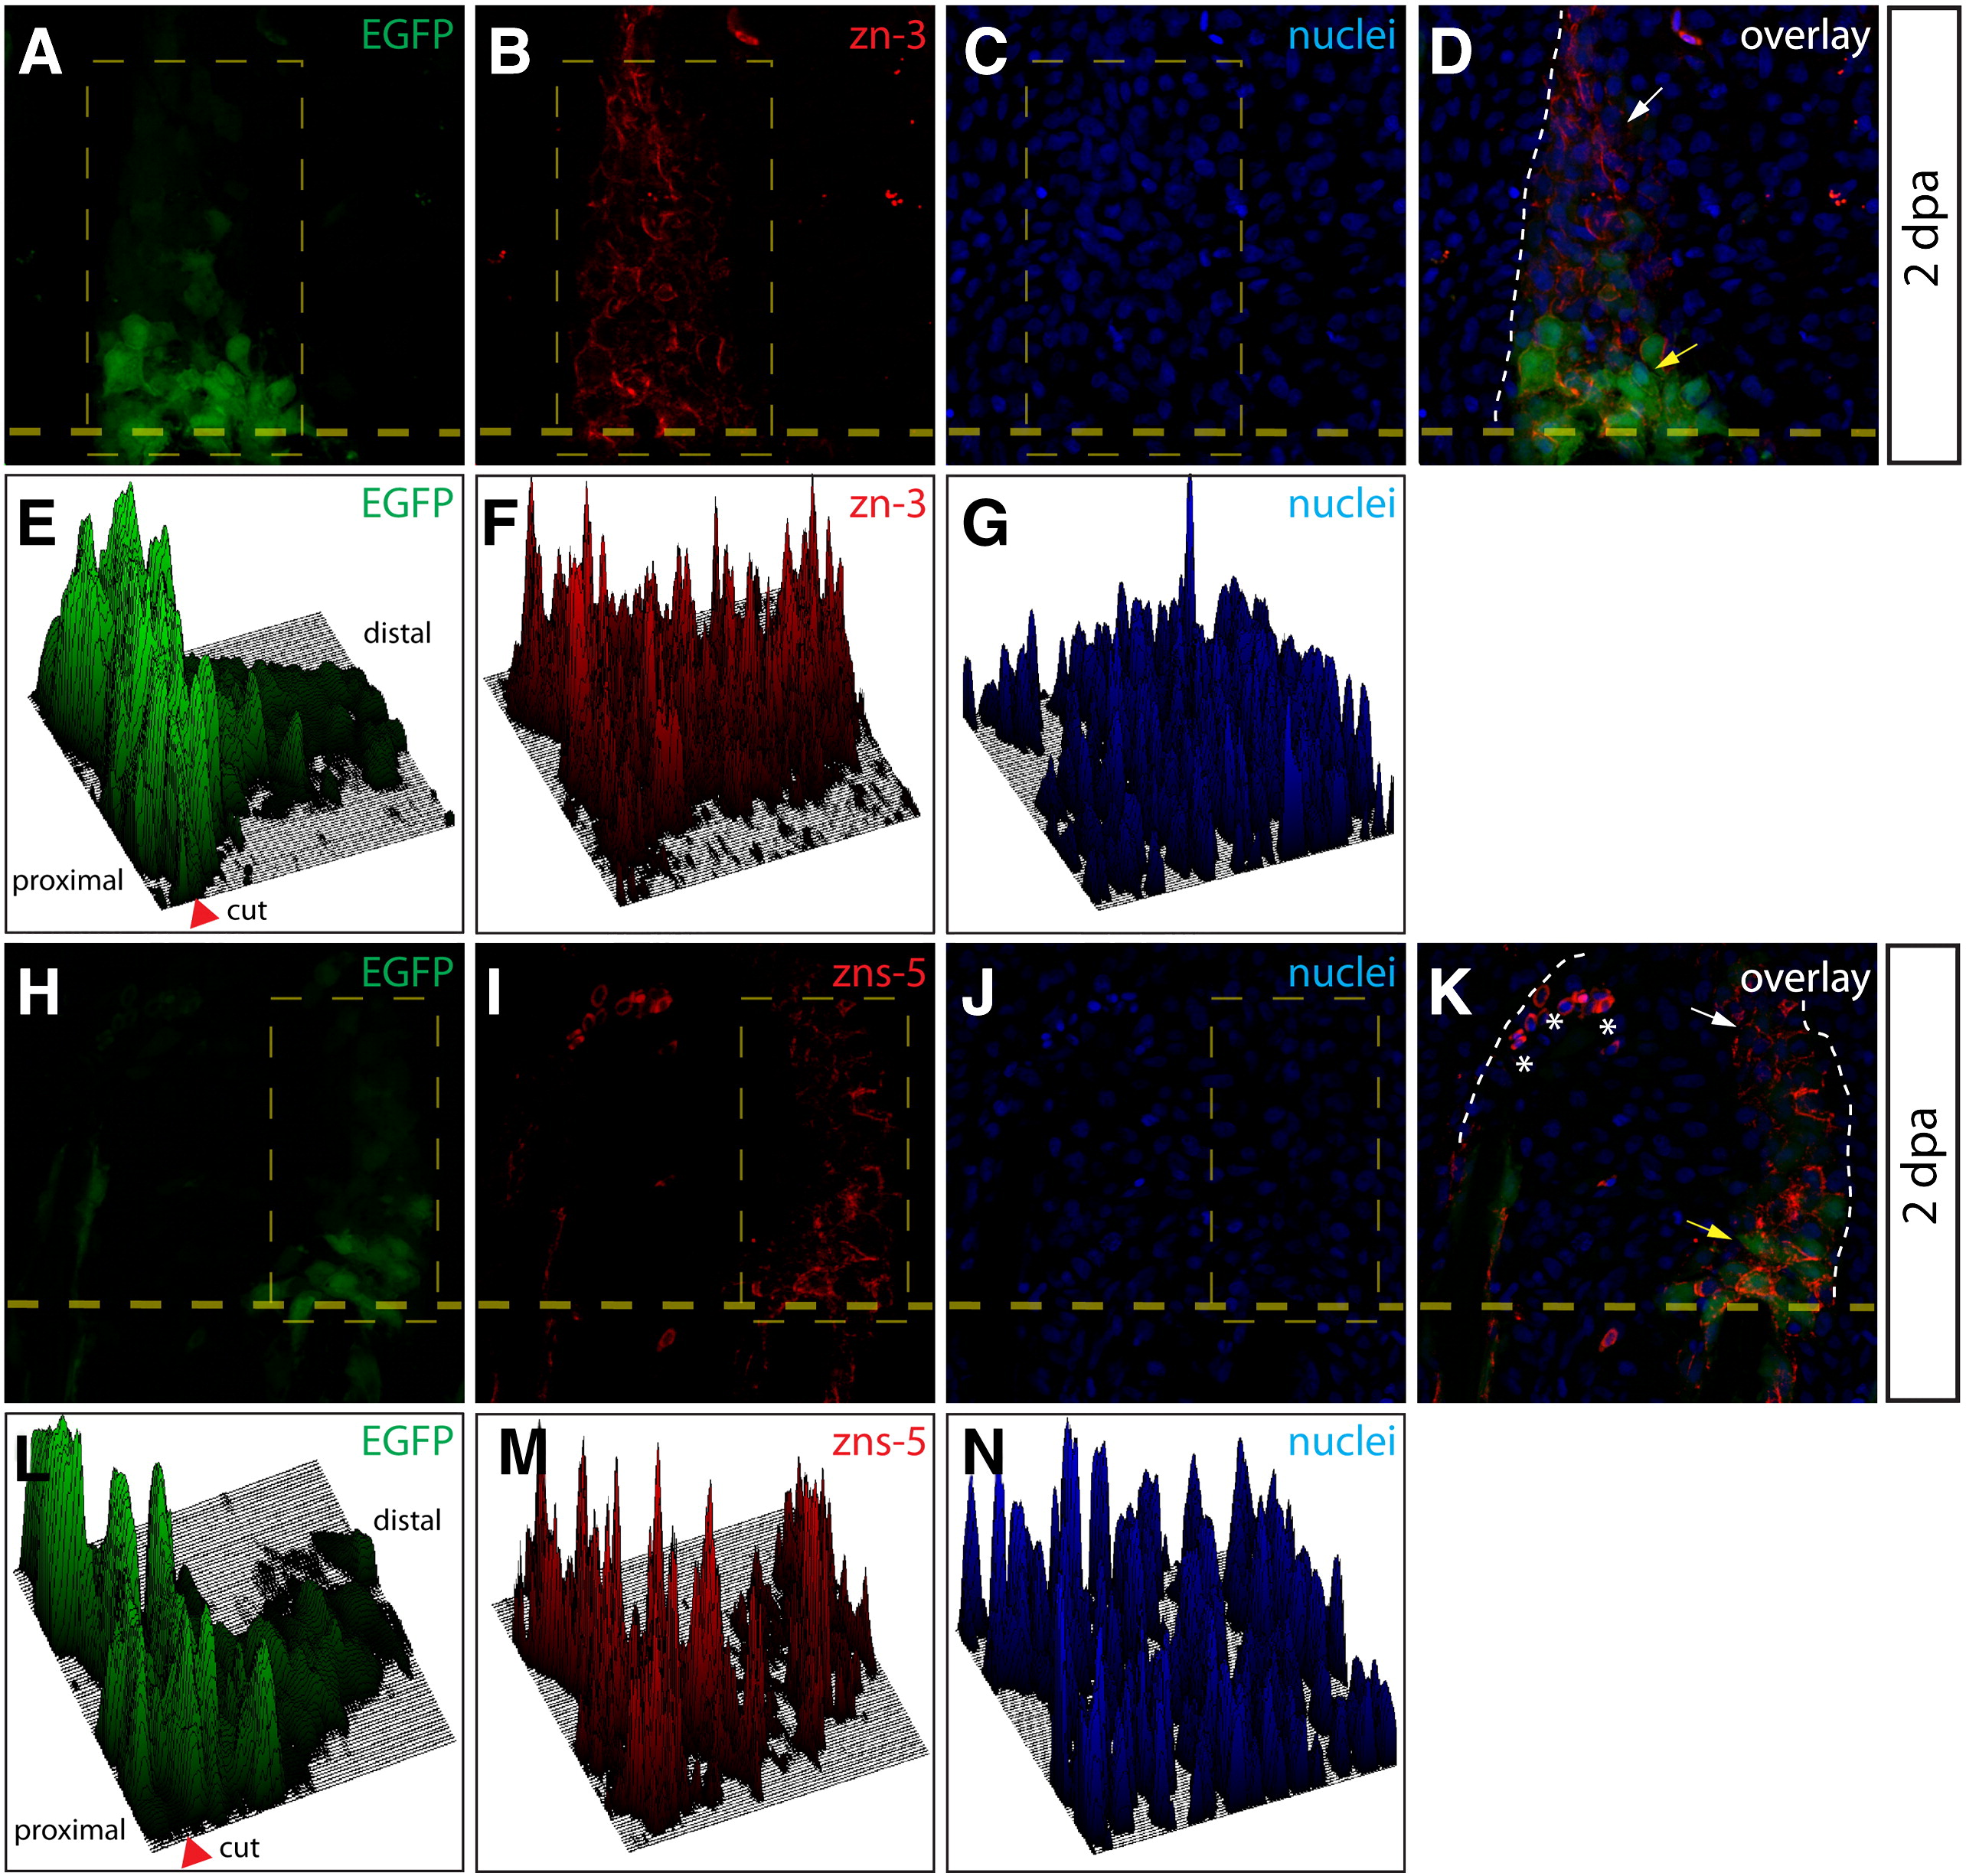
Osteoblasts dedifferentiate within the blastema. (A?D, H?K) Longitudinal sections from a Tg(sp7:EGFP) animal 2 dpa stained with zn-3 (A-D) or zns-5 antibodies (H?K). White arrows point to EGFP-/zn-3+ (or zns-5+) immature, dedifferentiated osteoblasts and yellow arrows point to EGFP+/zn-3+ (or zns-5+) mature, differentiated osteoblasts. EGFP signal is shown in green, zn-3+ (B, D), or zns-5+ (I, K) cells are red, and Hoechst-stained nuclei are blue. The border between epidermis and blastema is marked with a white dashed line. (E?G, L?M) Relative signal intensity levels for EGFP (E, L), zn-3 or zns-5 antibody staining (F, M), and Hoechst (G, N). Fluorescence intensity levels (z-axis) within the indicated rectangle (thin dashed yellow line) are plotted as a 3-dimensional surface using ImageJ software. The amputation site is marked with an arrowhead and the proximal and distal regions relative to the amputation site are indicated. The white dashed line indicates the border between epidermis and blastema.
Reprinted from Developmental Biology, 365(2), Stewart, S., and Stankunas, K., Limited dedifferentiation provides replacement tissue during zebrafish fin regeneration, 339-349, Copyright (2012) with permission from Elsevier. Full text @ Dev. Biol.