Fig. 5
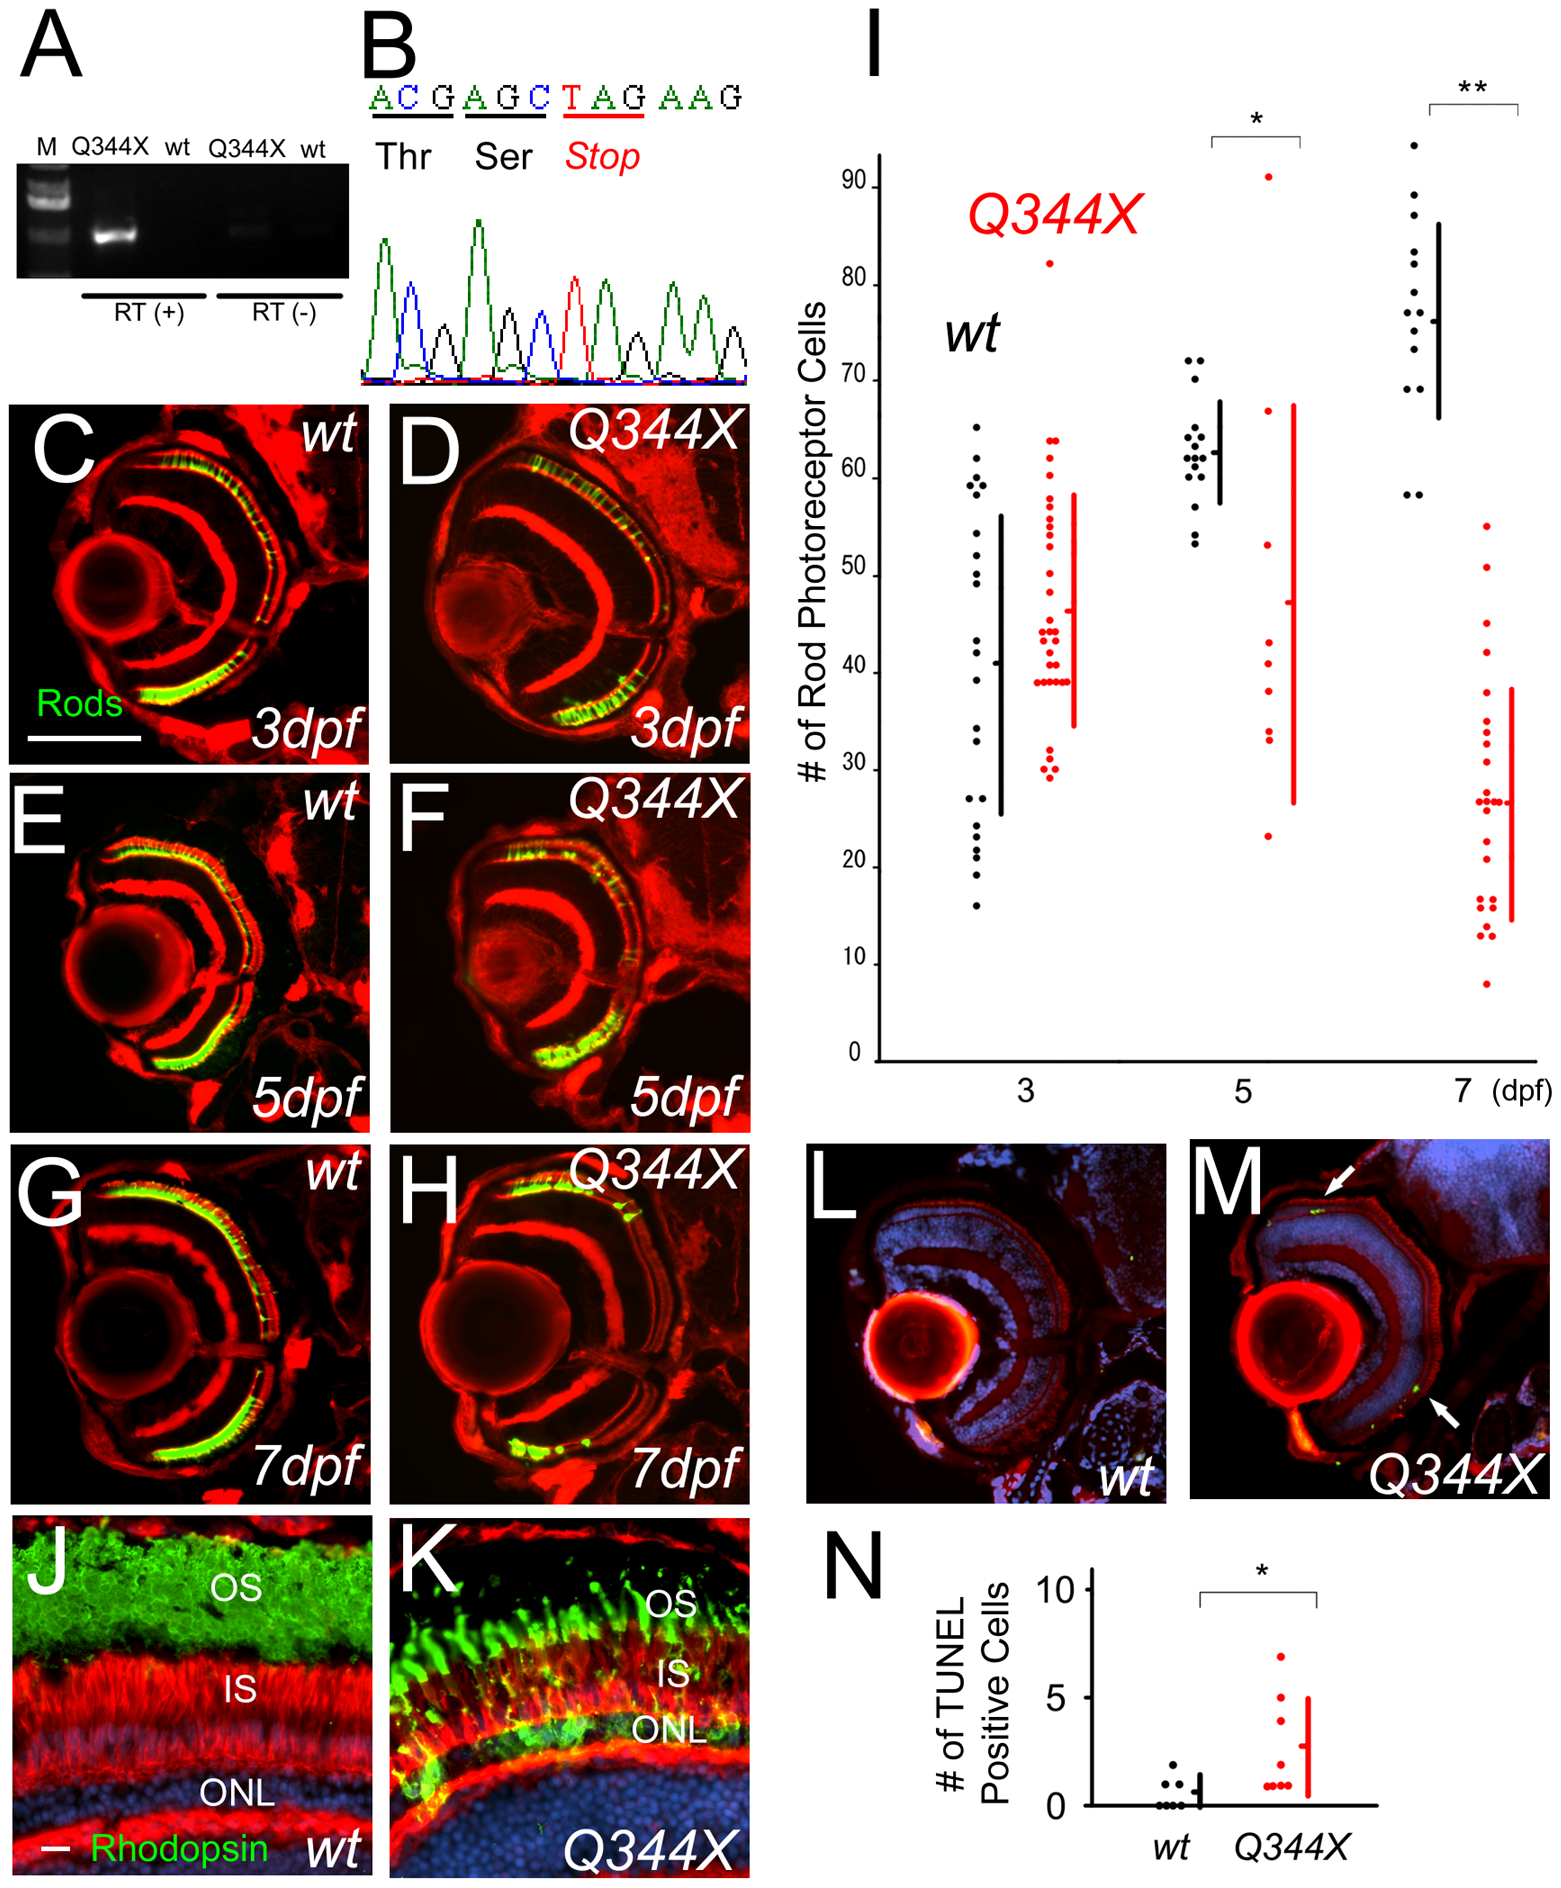
Rod photoreceptor cell death in rhodopsin Q344X transgenic fish.
(A) RT-PCR analysis of expression of ectopic rhodopsin Q344X transgene. (B) Sequence analysis of transgene in Q344X animal at 5 dpf. (C?H) Sections of normal rhodopsin fish at 3 dpf (C), 5 dpf (E), 7 dpf (G) and rhodopsin Q344X transgenic fish at 3 dpf (D), 5 dpf (F), 7 dpf (H). Rod photoreceptors are visualized with EGFP (green) and F-actin with phalloidin (red). (Bar = 100 μm.) (I) Graph of the number of rod photoreceptor of normal rhodopsin and rhodopsin Q344X mutant at 3, 5 and 7 dpf. (Bars mean SD, * means p<0.05, ** means p<0.01.) Rod photoreceptors decreased by 5 dpf. (J and K) Immunohistochemistry sections of retina of wild-type (J) and Q344X (K) animal. F-actin is visualized with phalloidin (red), rod opsin with antibodies (green) and nuclei with Hoechst33342 (blue). OS: outer segment, IS: inner segment, ONL: outer nuclear layer (Bar = 10 Ám.) Cell localization of rhodopsin is abnormal in Q344X. (L and M) TUNEL (green) assay of sections of normal rhodopsin (L) and rhodopsin Q344X transgenic (M) animals. F-actin is visualized with phalloidin (red), and nuclei with DAPI (blue). Arrows indicate TUNEL positive photoreceptor cells. TUNEL staining in ONL was observed only in Q344X. (N) Graph of the number of TUNEL assay positive cells, comparing normal rhodopsin (black dots) and rhodopsin Q344X (red dots) transgenic animals. (Bars mean SD, * means p<0.05.)

