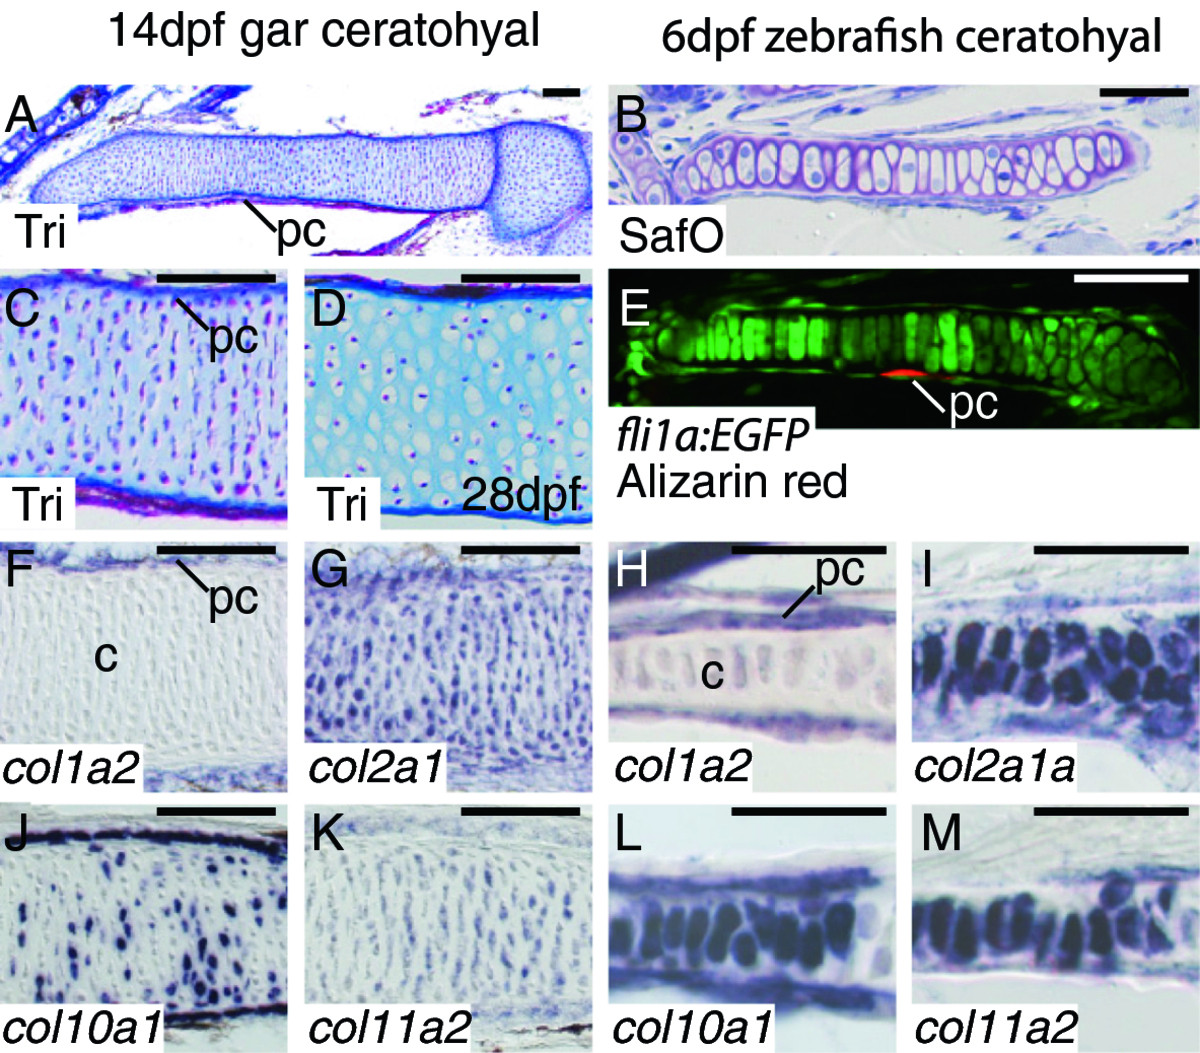
Fig. 3
Collagen expression is equivalent in chondrocytes of gar and zebrafish. A, C, D, Trichrome-stained coronal gar sections. B, Safranin O-stained coronal zebrafish section. E, confocal slice of ceratohyal in fli1a:EGFP zebrafish, which have GFP expression in skeletogenic neural crest cells [47] and Alizarin red staining of calcified bone matrix. F-M, in situ hybridization on coronal sections. Trichrome staining of the 14 dpf gar ceratohyal (A) shows hundreds of chondrocytes, which had not yet undergone hypertrophy (B), and a thin layer of Aniline blue-stained bone matrix in the perichondrium. Mid-diaphyseal gar chondrocytes had undergone hypertrophy by 28 dpf (C). Safranin O staining identifies cartilage matrix of the 6 dpf zebrafish ceratohyal (B), while confocal imaging of fli1a:EGFP transgenic zebrafish ceratohyal (E) illustrates chondrocyte morphology and bone matrix deposition (Alizarin red) in the perichondrium. At these timepoints, chondrocytes in both gar and zebrafish failed to express col1a2 (F, H), whereas transcripts for col2a1 (G, I), col10a1 (J, L), and col11a2 (K, M) were detected in mid-diaphyseal mature chondrocytes. All of these collagen genes were expressed in developing perichondrium of both gar and zebrafish ceratohyal. Scale bars: A-M = 50 μm. Abbreviations: c = cartilage; dpf = days post-fertilization; pc = perichondrium; SafO = Safranin O; Tri = Trichrome.

