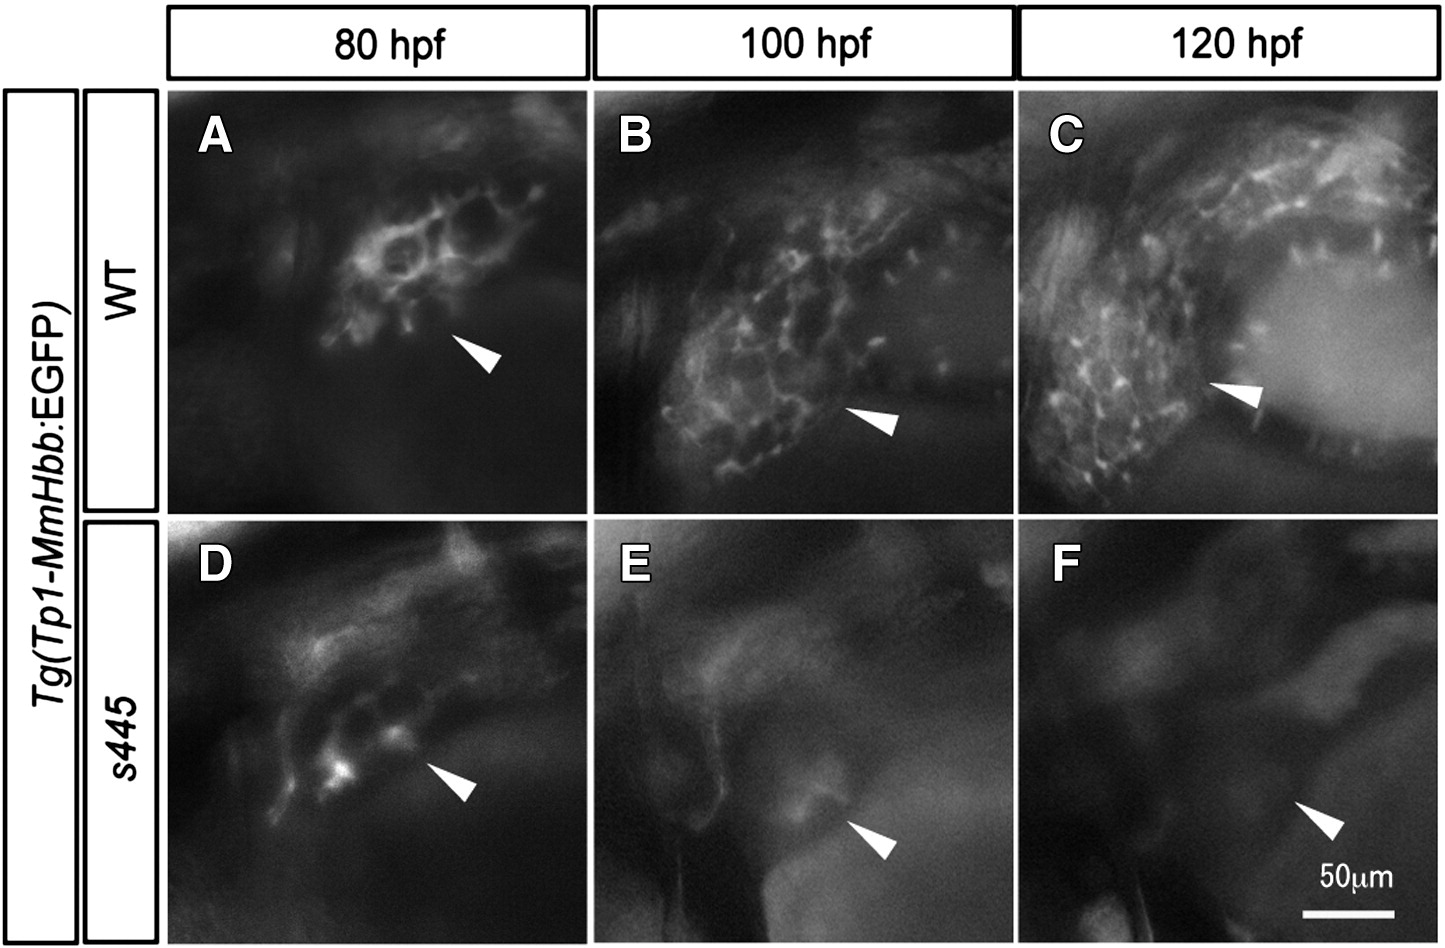
Fig. 2
Time course observation of intrahepatic biliary network development. (A?C) Tg(Tp1-MmHbb:EGFP)um14 expression in the wild-type intrahepatic biliary network at 80 (A), 100 (B) and 120 (C) hpf; same larva is shown at all stages. (D?F) Tg(Tp1-MmHbb:EGFP)um14 expression in the s445 mutant intrahepatic biliary network at 80 (A), 100 (B) and 120 (C) hpf; same larva is shown at all stages. At 80 hpf, Tg(Tp1-MmHbb:EGFP)um14 expression in the s445 mutant intrahepatic biliary network is indistinguishable from that of wild-type, however it disappears after 100 hpf. Lateral views, anterior to the left. White arrowheads point to the liver in each image.
Reprinted from Developmental Biology, 363(1), Schaub, M., Nussbaum, J., Verkade, H., Ober, E.A., Stainier, D.Y., and Sakaguchi, T.F., Mutation of zebrafish Snapc4 is associated with loss of the intrahepatic biliary network, 128-137, Copyright (2012) with permission from Elsevier. Full text @ Dev. Biol.

