
|
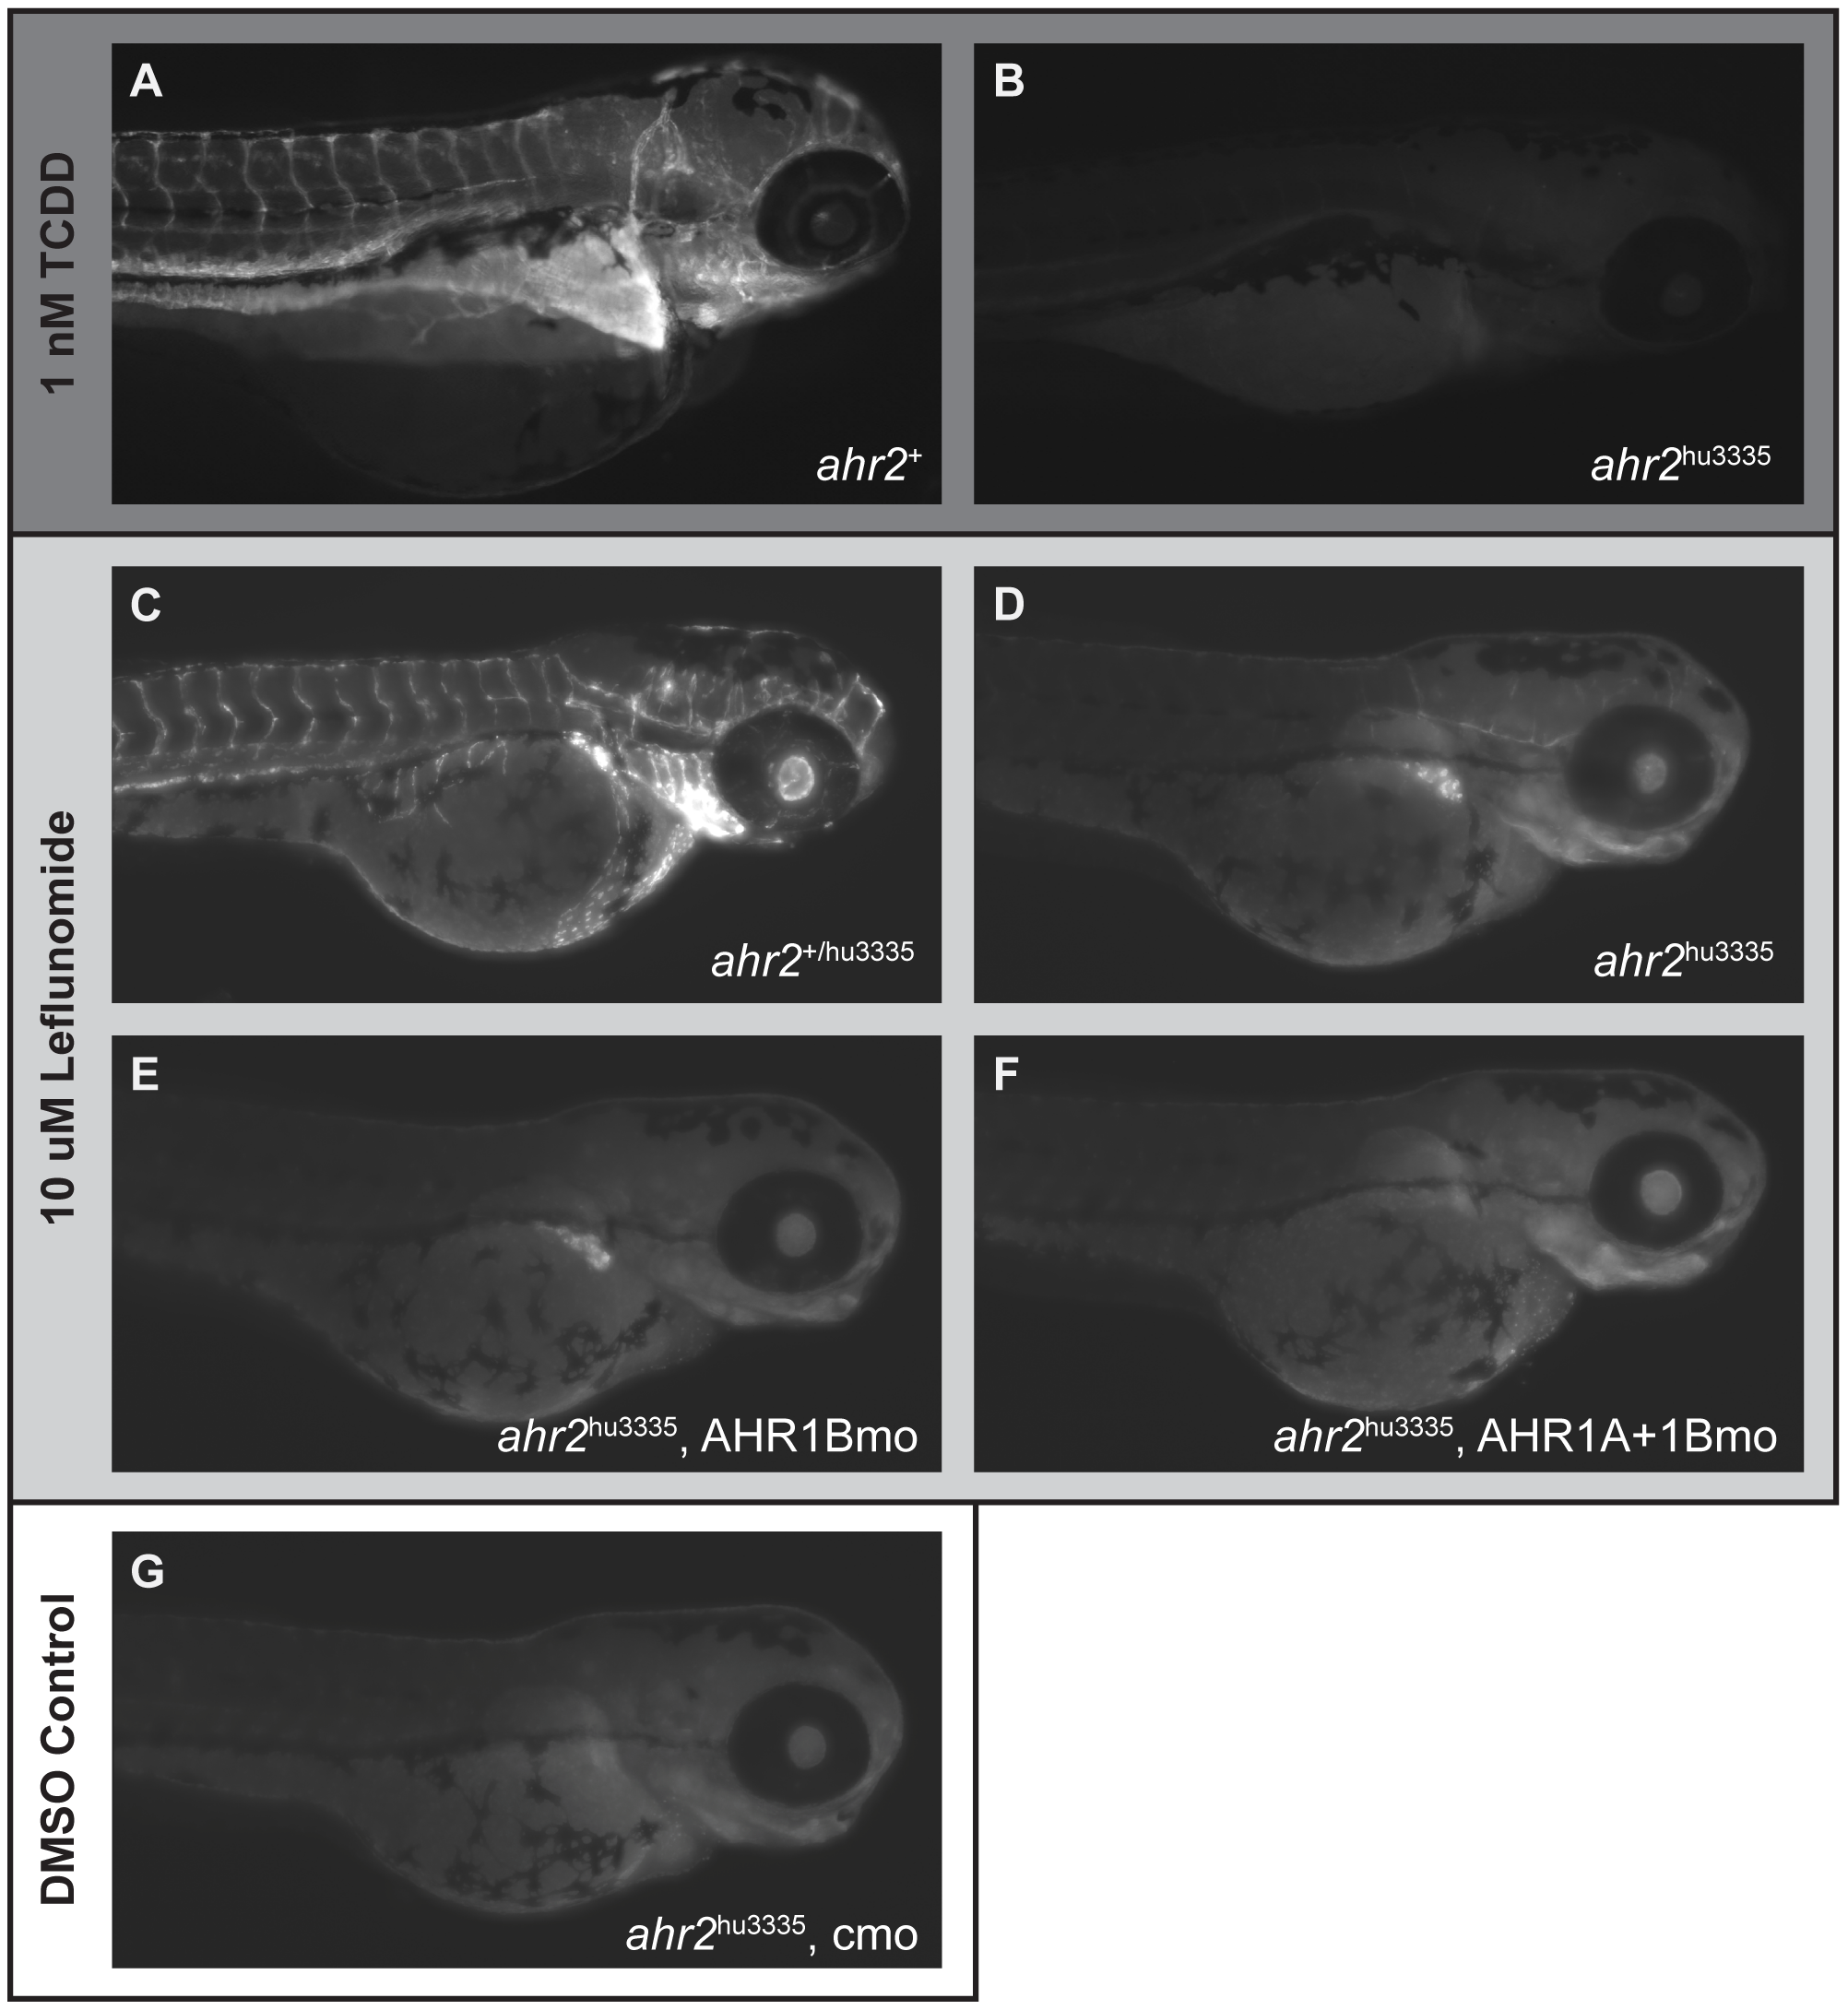
Fig. 6
CYP1A protein expression patterns are ligand- and AHR isoform-dependent.
CYP1A expression at 120 hpf in (A) ahr2+ and (B) ahr2hu3335 larvae following exposure to 1 nM TCDD from 6?24 hpf. C) Leflunomide-induced CYP1A expression at 72 hpf in wild-type and (D) ahr2hu3335 mutants. E) Leflunomide-induced CYP1A expression in AHR1B-morphant ahr2hu3335 larvae and F) ahr2hu3335 larvae co-injected with AHR1A and AHR1B morpholinos. (G) DMSO control. TCDD-exposed embryos were IHC processed side-by-side and imaged at 120 hpf using the same exposure settings and a single focal plane. Leflunomide-exposed embryos and DMSO control were processed side-by-side and imaged at 72 hpf using the same exposure times; images were created from a z-stack of 10 15.4 uM slices centered on the liver.