
|
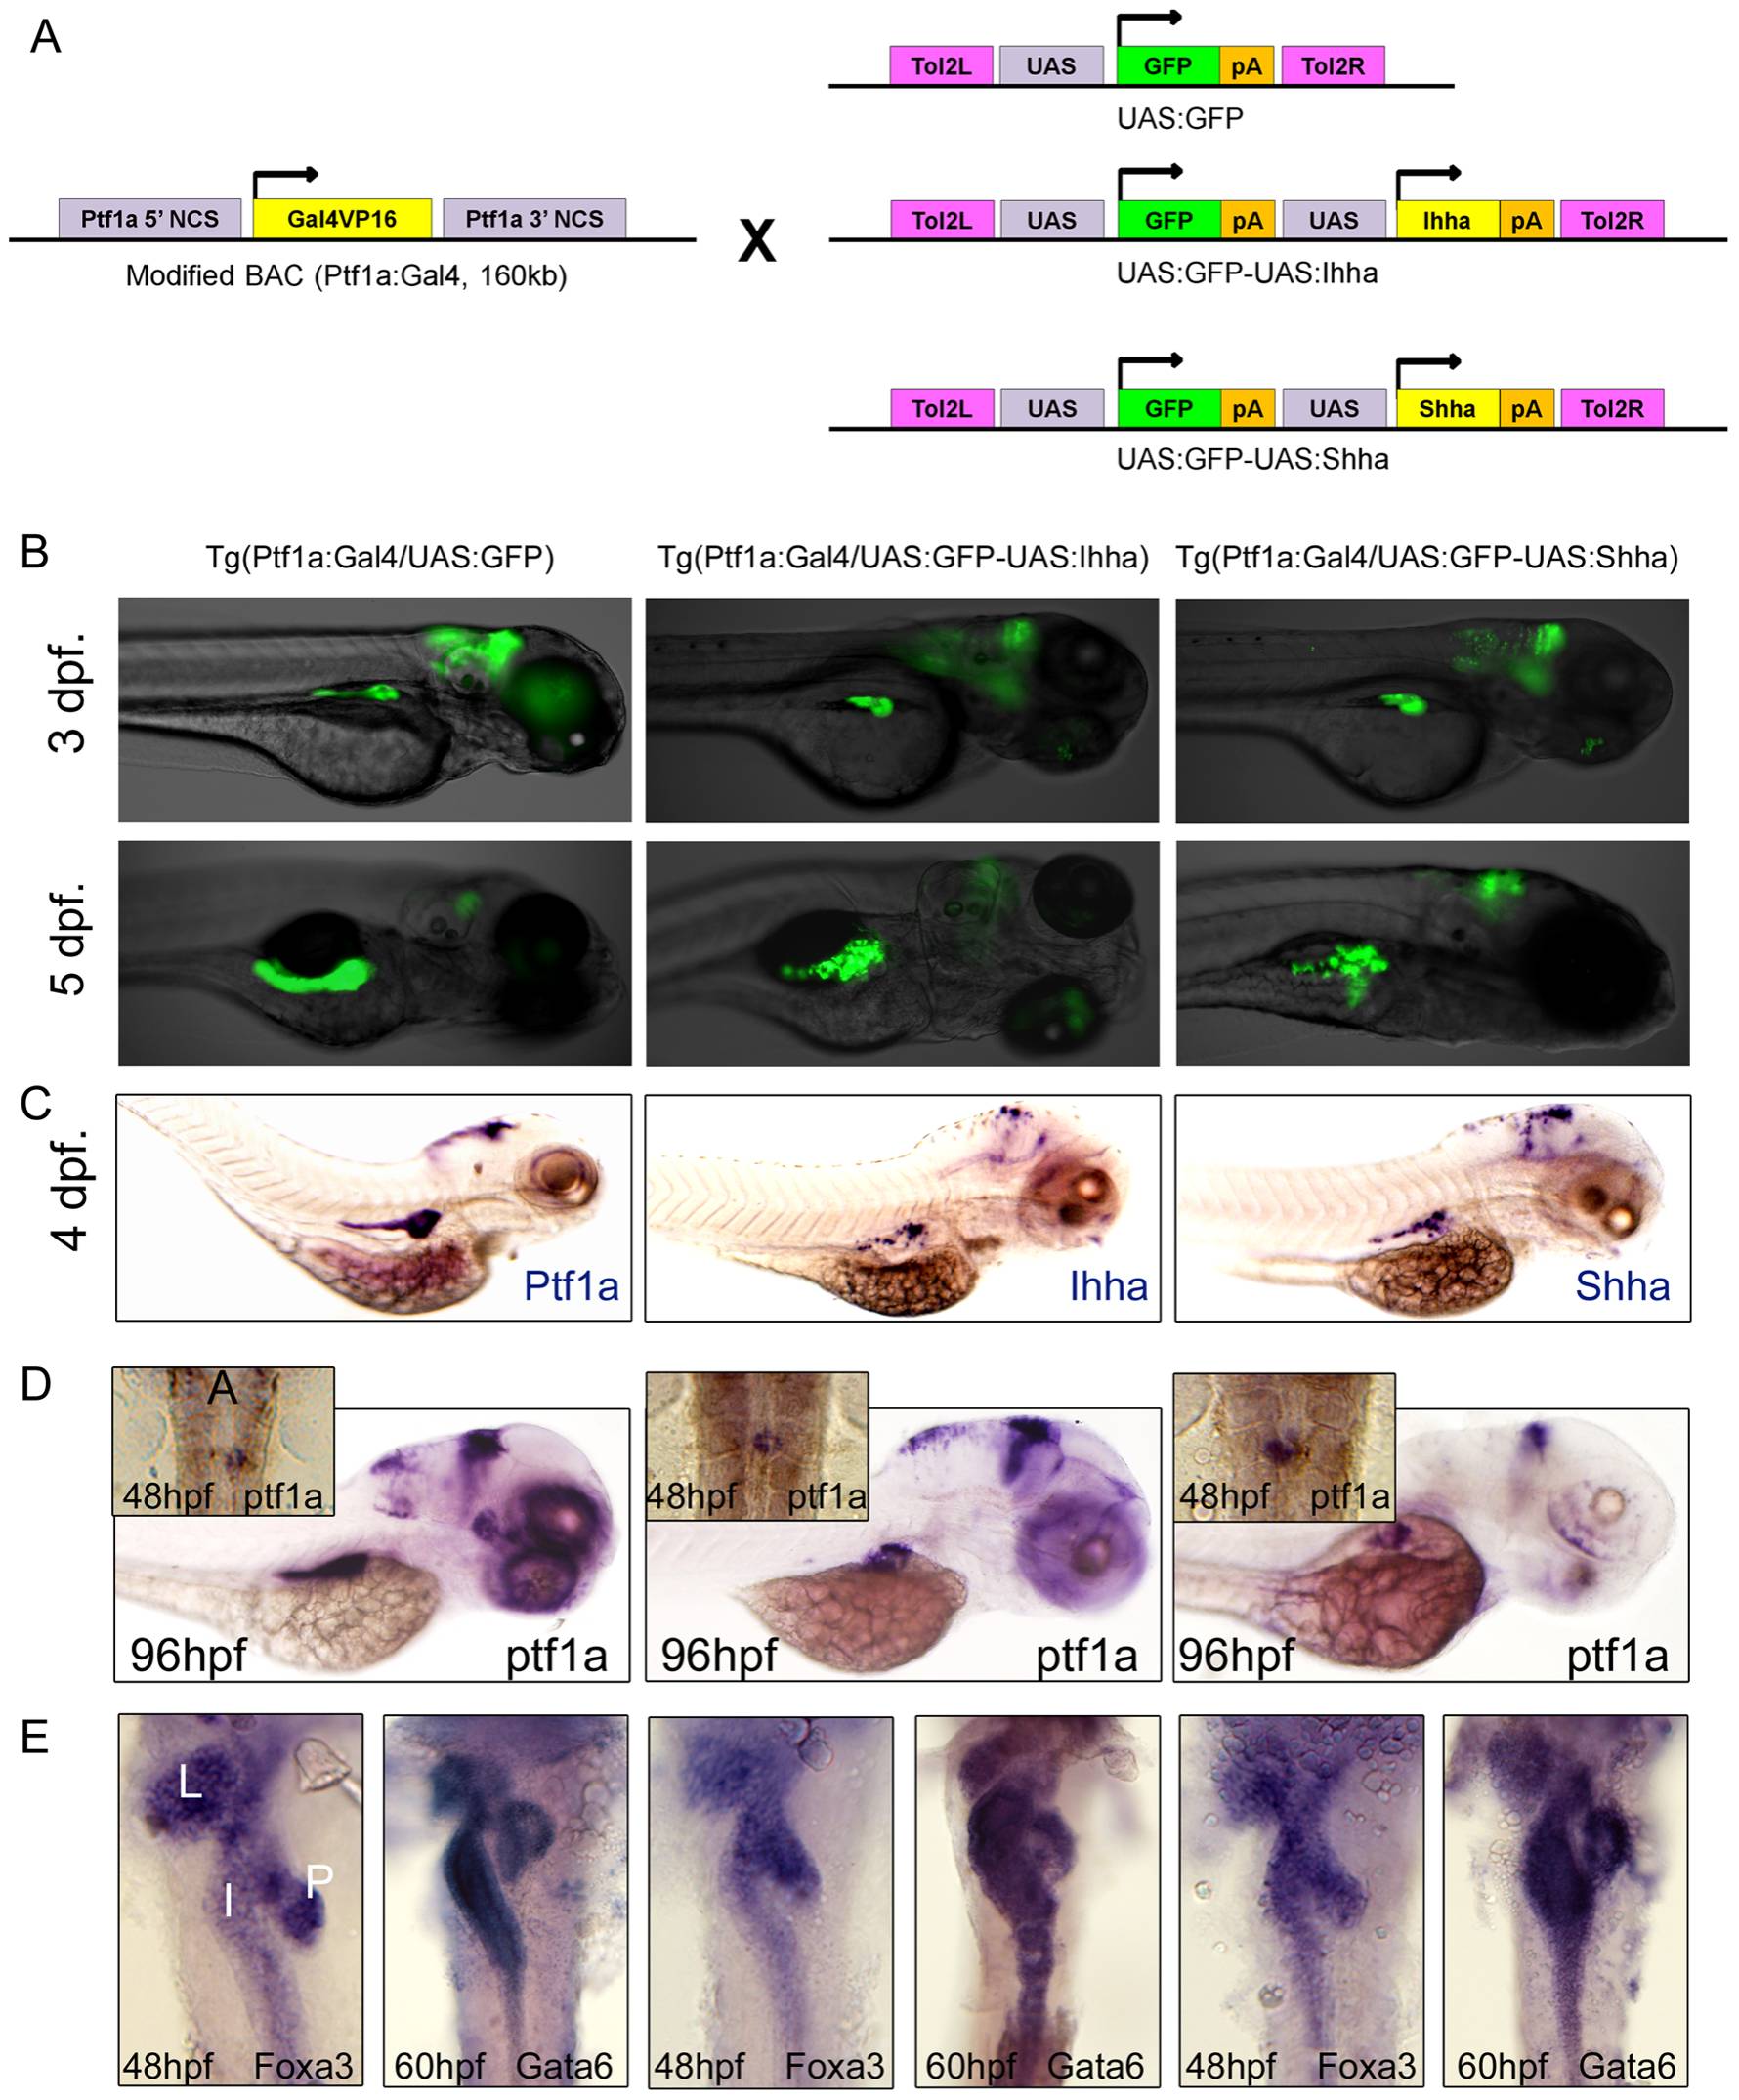
Fig. 1 Short-term phenotypes.
(A) Transgenesis strategy. (B, C) Inverted fluorescence and transgene ISH images show mosaic pattern of transgene expression in Hh ligand-expressing embryos. (D) Whole mount ISH for ptf1a at 48 and 96 hpf. Inlet figures are dorsal views with anterior to the top. A, anterior. Hh over-expression did not impair migration of ptf1a-expressing exocrine progenitor cells, showing ptf1a positive exocrine cells surrounding principal islet at 48 hpf. (E) Whole mount ISH for Foxa3 and Gata6, endodermal markers during development. Dorsal views with anterior to the top. The FoxA3 and Gata6 are properly expressed in the liver, intestine, and exocrine pancreas, and the endodermal morphologies are not affected by Hh over-expression. L, Liver; I, Intestine; P, Exocrine pancreas.