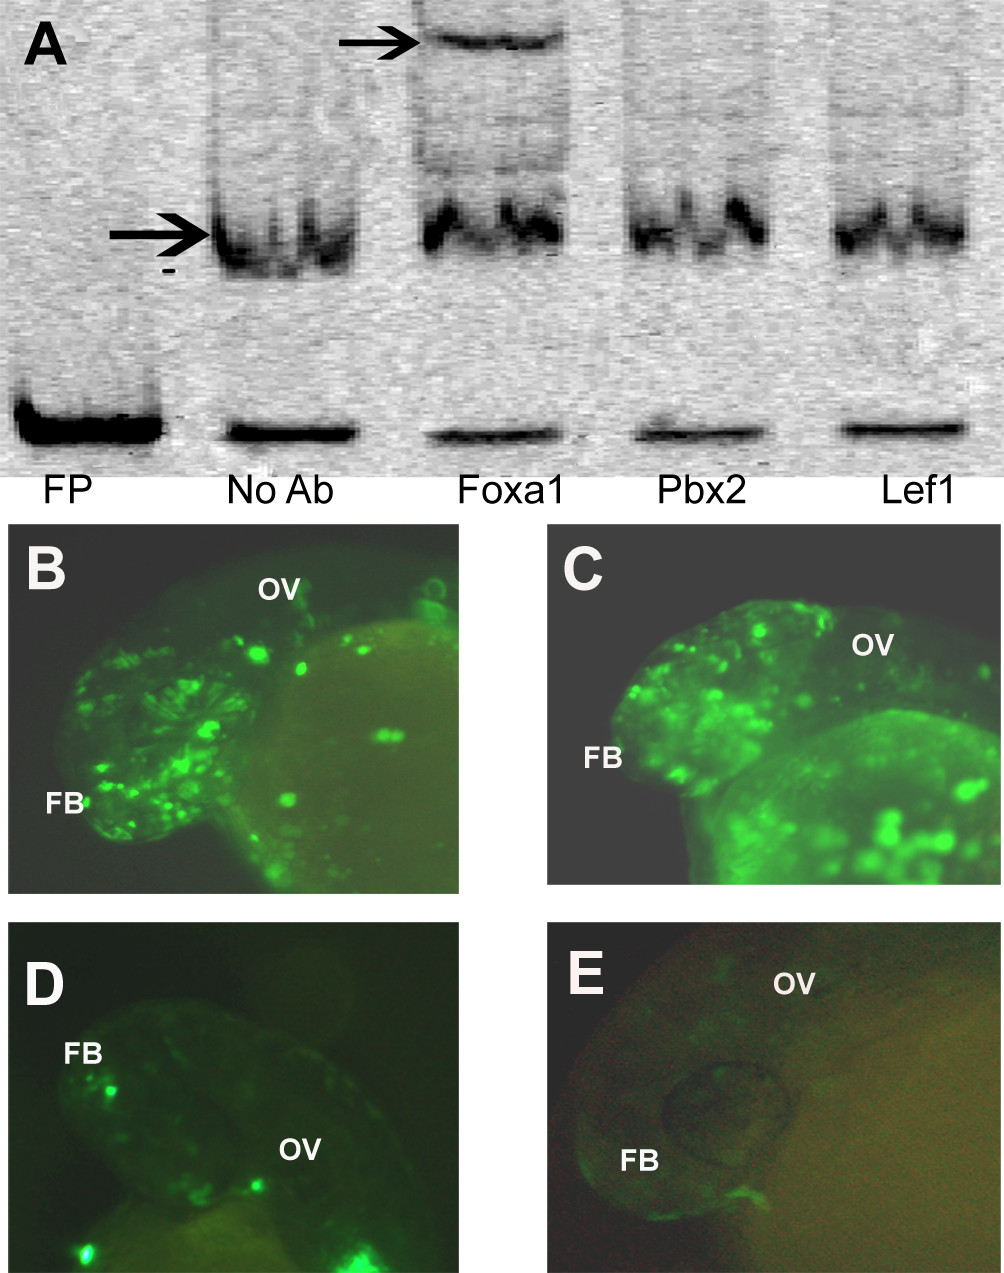
Fig. 8 Elucidation of transcription factor binding to the enhancer. (A) Supershift assay with Foxa1, Pbx2 and Lef1 antibodies. Black arrow in no Ab lane denotes the shift and the one in Foxa1 added lane denotes supershift. (B) Expression of the 40 bp sequence (EM4) driven EGFP construct in forebrain (FB) and otic vesicle (OV) which are domains of expression of otx1b at 24 hpf. (C) Co-injection of the 40 bp enhancer along with a scrambled morpholino, showing no down regulation of the enhancer activity at 24 hpf. (D) Co-injection of the 40 bp enhancer along with morpholino 1 (M1) against Foxa1 showing reduction in the enhancer activity at 24 hpf. (E) Co-injection of the 40 bp enhancer along with morpholino 2 (M2) against Foxa1 showing reduction in the enhancer activity at 24 hpf.
Image
Figure Caption
Acknowledgments
This image is the copyrighted work of the attributed author or publisher, and
ZFIN has permission only to display this image to its users.
Additional permissions should be obtained from the applicable author or publisher of the image.
Full text @ BMC Dev. Biol.

