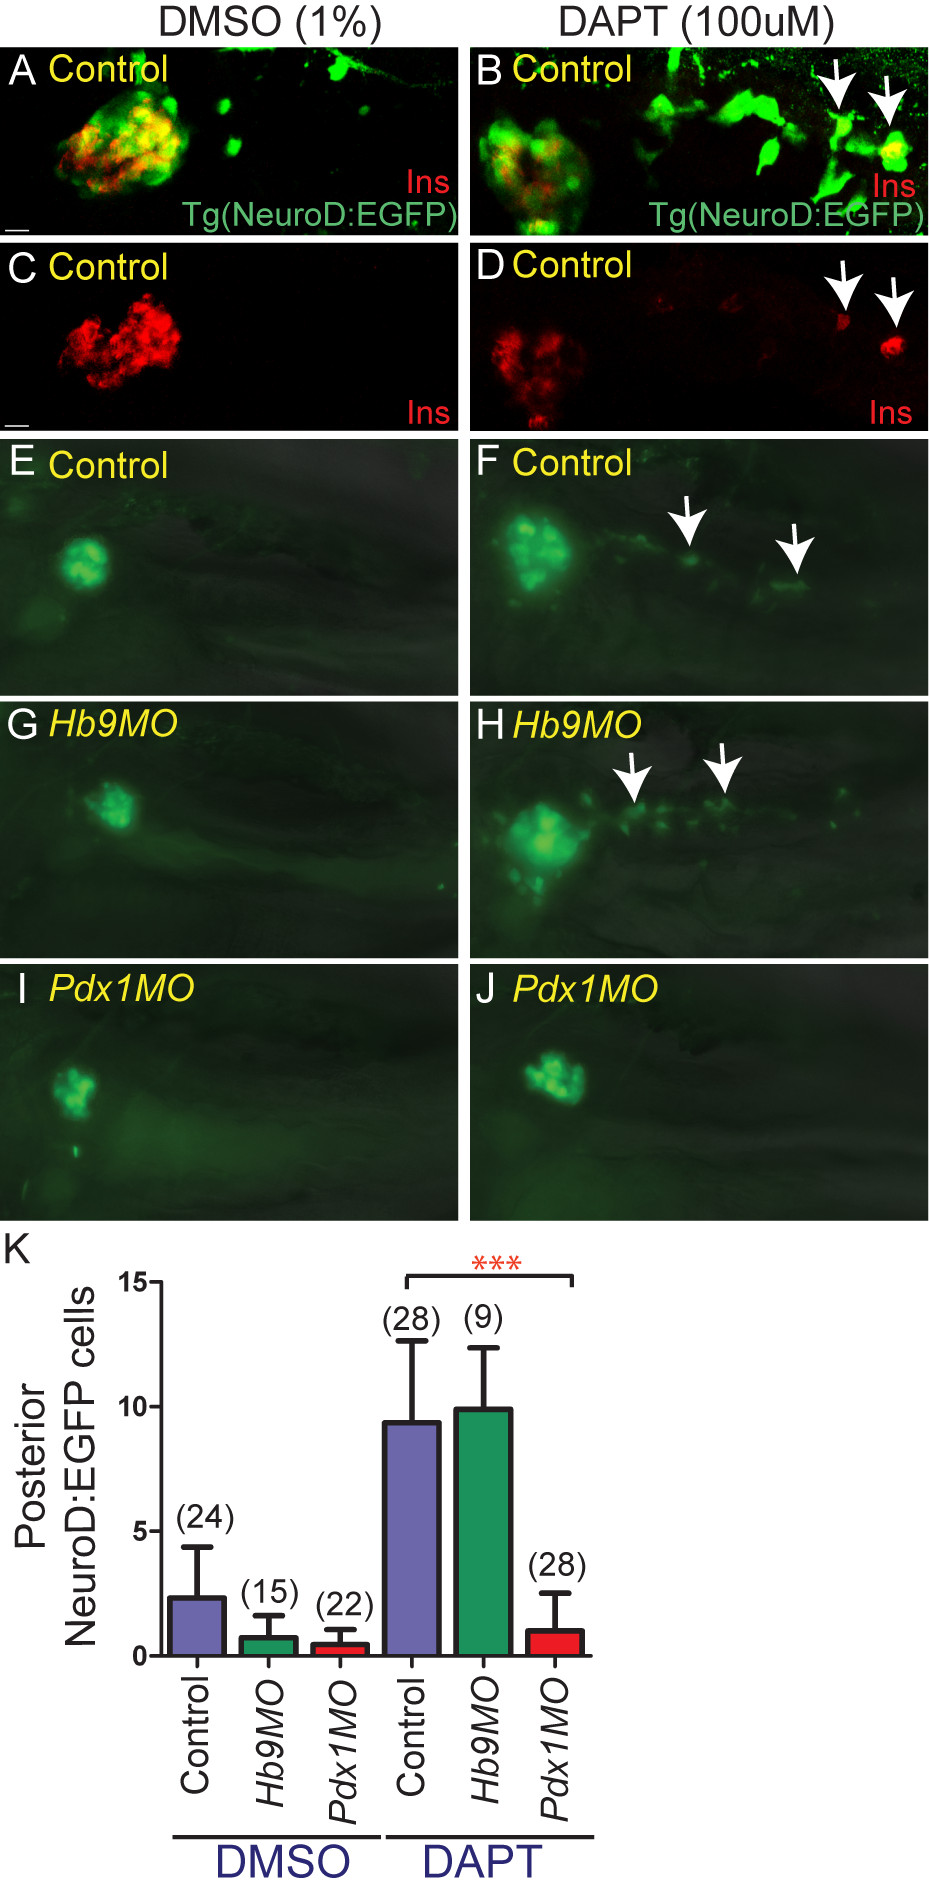
Fig. 6 Notch-responsive endocrine progenitors are absent in pdx1 morphants. (A-D) Confocal image projections of Tg(NeuroD:EGFP)nl1 embryos immunostained for green fluorescent protein (GFP) and insulin. Optical sections that obscure the posterior pancreatic tail have not been included. (E-J) Native enhanced green fluorescent protein (EGFP) expression in the pancreas of living TgBAC(NeuroD:EGFP)nl1 embryos at 5.5 days post fertilization (dpf), with overlay of concurrently acquired brightfield image. Shown are uninjected control embryos (A-D, E, F), hb9 morphants (G,H) and pdx1 morphants (I,J) treated either with vehicle (dimethylsulfoxide (DMSO)) (A,C,E,G,I) or 100 mM N-[N-(3,5-difluorophenacetyl)-L-alanyl]-S-phenylglycine t-butyl ester (DAPT) (B,D,F,H,J) from 3 to 5 dpf. DAPT treatment in control embryos leads to the induction of EGFP expression in the pancreatic tail (A,B,E,F) and of Ins in individual of these EGFP+ cells (B, D). In hb9 morphants the patterns of EGFP expression in DMSO-treated and DAPT-treated embryos are similar to that in control embryos (E-H), while pdx1 morphants show decreased EGFP+ cells in the principal islet and virtually no posterior EGFP+ cells are induced by DAPT (I,J). All embryos lateral view, anterior to the left. Scale bar = 10 μM. (K) Quantitation of NeuroD:EGFP cells induced in the pancreatic tail following DAPT treatment in control and morphant embryos. Graphed are the mean and SD for (n) number of embryos. P values were determined using one-way analysis of variance (ANOVA) with Bonferroni′s post test, ***P < 0.001.
Image
Figure Caption
Figure Data
Acknowledgments
This image is the copyrighted work of the attributed author or publisher, and
ZFIN has permission only to display this image to its users.
Additional permissions should be obtained from the applicable author or publisher of the image.
Full text @ BMC Biol.

