Fig. 4
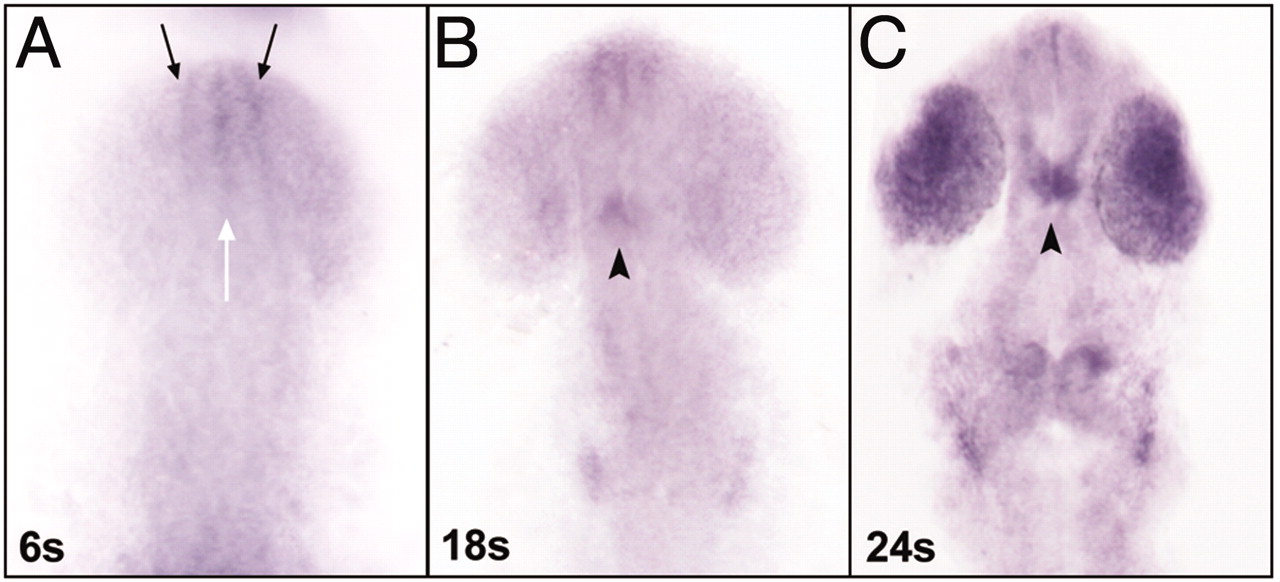
Spatio-temporal expression pattern of zper2 during neurogenesis. Whole-mount ISH analysis of zper2 mRNA in 12- to 22-h embryos after light treatment (dorsal view, anterior to the top) is shown. (A) Enhanced zper2 mRNA expression is detected at the lateral edge of the anterior neural plate (black arrows) and the median region of the neural plate (white arrow) beginning at the 6-somite-stage (12 hpf). (B and C) Expression of zper2 at the pineal gland primordium (black arrowhead) begins at the 18-somite stage (18 hpf, B) and is further enhanced at the 24-somite stage (C). At this stage, enhanced zper2 expression also occurs in the eye area. s, somites.

