
Image
|
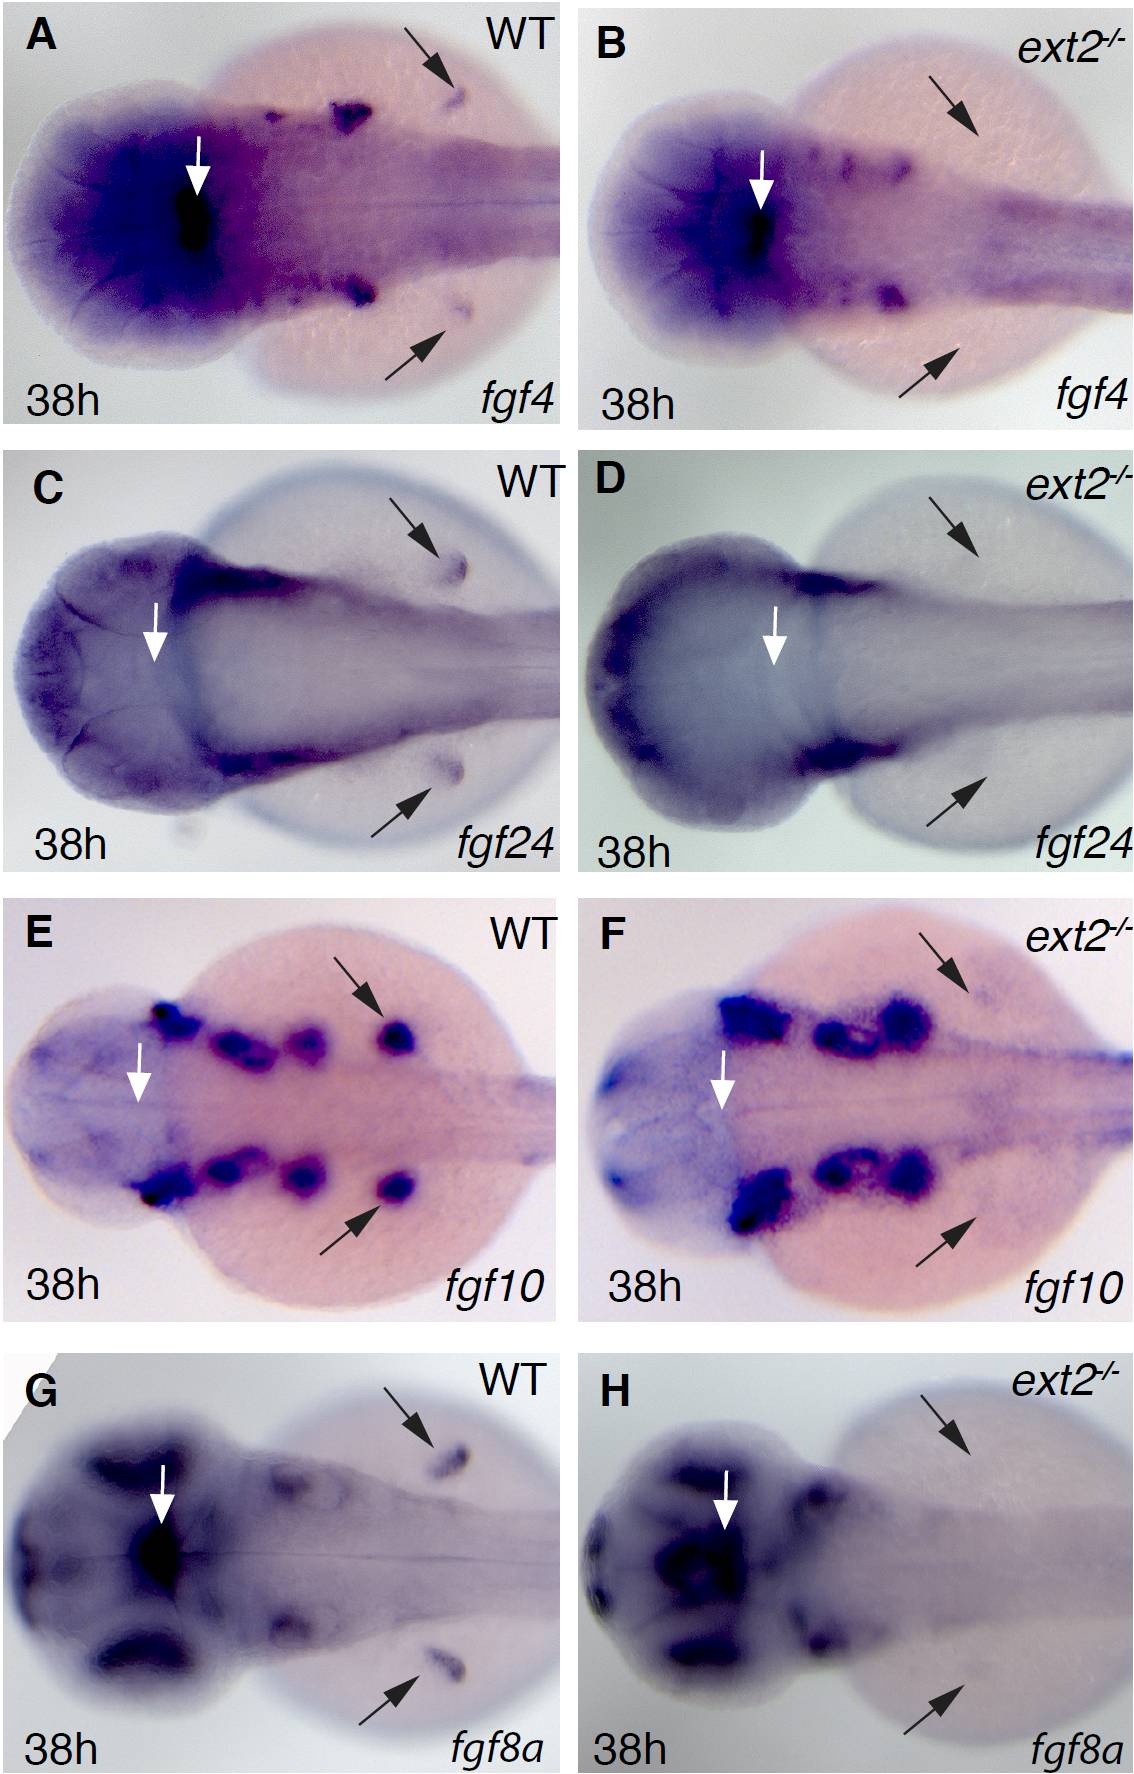
Figure Caption
Fig. S1 Expression of fgf genes in ext2 mutants. Dorsal view of fgf4 (A-B), fg24 (C-D), fgf10 (E-F), fgf8 (G-H) expression in control embryos (left panels) and ext2 mutants (right panels) at 38 hpf. Note that comparable levels of all examined fgf genes are expressed at 38 hpf, with the exception of the developing pectoral fin. Black arrows label the presence (left panels) or absence (right panels) of developing pectoral fins.
Acknowledgments
This image is the copyrighted work of the attributed author or publisher, and
ZFIN has permission only to display this image to its users.
Additional permissions should be obtained from the applicable author or publisher of the image.
Full text @ BMC Dev. Biol.