
Image
|
Figure Caption
Fig. 3
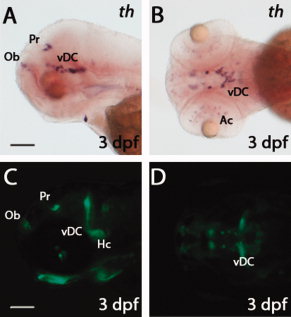
Comparison of th and green fluorescent protein (GFP) expression patterns in Tg(dat:EGFP) larvae. A,B: Whole-mount in situ hybridization showing tyrosine hydroxylase (th) expression in 3 days post-fertilization (dpf) larvae. C,D: Live images showing GFP expression in 3 dpf Tg(dat:EGFP) larvae. Panels A, C are lateral views with anterior to the left; panels B, D are ventral views. The following abbreviations are used: olfactory bulb (Ob), pretectum (Pr), ventral diencephalon (vDC), amacrine cells (Ac) and caudal hypothalamus (Hc). Scale bars = 100 μm.
Figure Data
Acknowledgments
This image is the copyrighted work of the attributed author or publisher, and
ZFIN has permission only to display this image to its users.
Additional permissions should be obtained from the applicable author or publisher of the image.
Full text @ Dev. Dyn.