
|
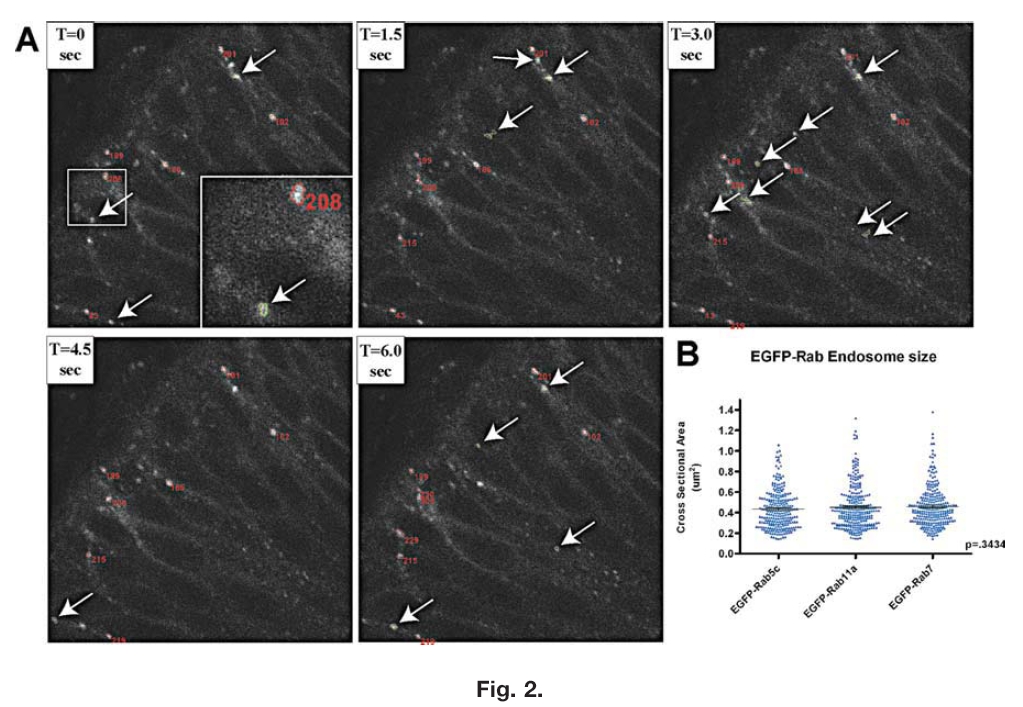
Fig. 2
Tracking and cross-sectional area. Determination of EGFP-Rab-positive endosomes. A: Example of the tracking software over five time-series of an EGFP-Rab5c embryo. Tracked endosomes are automatically circled in red and are given an identification number to correlate numerical data in generated spreadsheets with visual images. Arrows point to endosomes recognized by the program (outlined in green) that were not followed for a minimum of five consecutive frames, and, therefore, no data were obtained from these endosomes and they were not given identification numbers. Insert in panel T=0 is a higher magnification of the boxed region showing numbering and outlining of tracked endosomes. T represents progression of time in seconds between frames. B: Distribution of cross-sectional area measurements determined for each of the EGFP-Rab lines. Most of the tracked endosomes have cross-sectional areas between 0.2 and 0.6 μm2, with very few endosomes larger than 1 μm2. P value is calculated from a one-way ANOVA.