
|
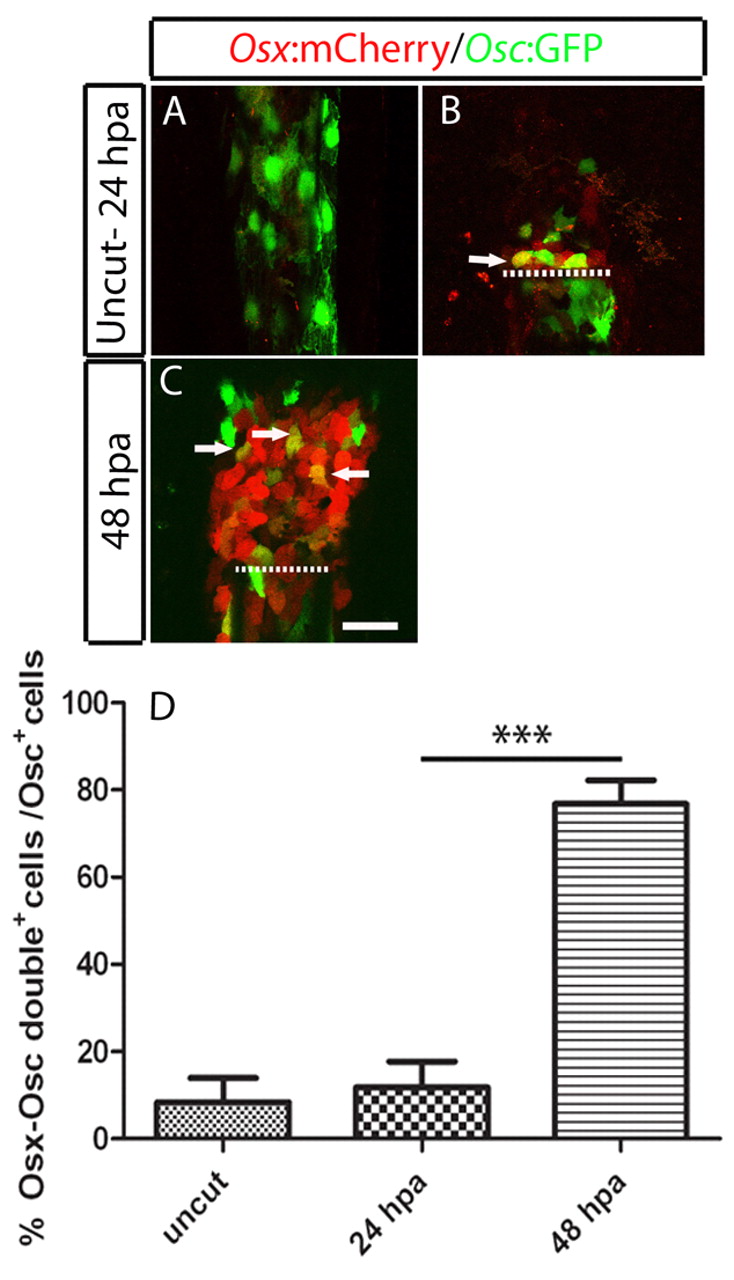
Fig. 6
osteocalcin-positive scleroblasts at the blastema start to express de novo osterix, an early marker for skeletal differentiation. (A-C) osterix- and osteocalcin-reporter expression in double Tg(osterix:mCherry; osteocalcin:GFP) fins. (A) Uncut fin. (B) 24 hpa fin. (C) 48 hpa fin. In B and C the arrows indicate cells co expressing osterix and osteocalcin. Each image is a projection of several confocal optical slices. (D) Percentage of double-positive, osterix- and osteocalcin-expressing cells over the total of osteocalcin-expressing cells in the blastema population. There was a significant increase at 48 hpa compared with the uncut and 24 hpa samples (Student′s t-test, P<0.05; n=5 or 6 for each condition). Scale bar: 50 μm. Dashed lines indicate amputation plane.