
|
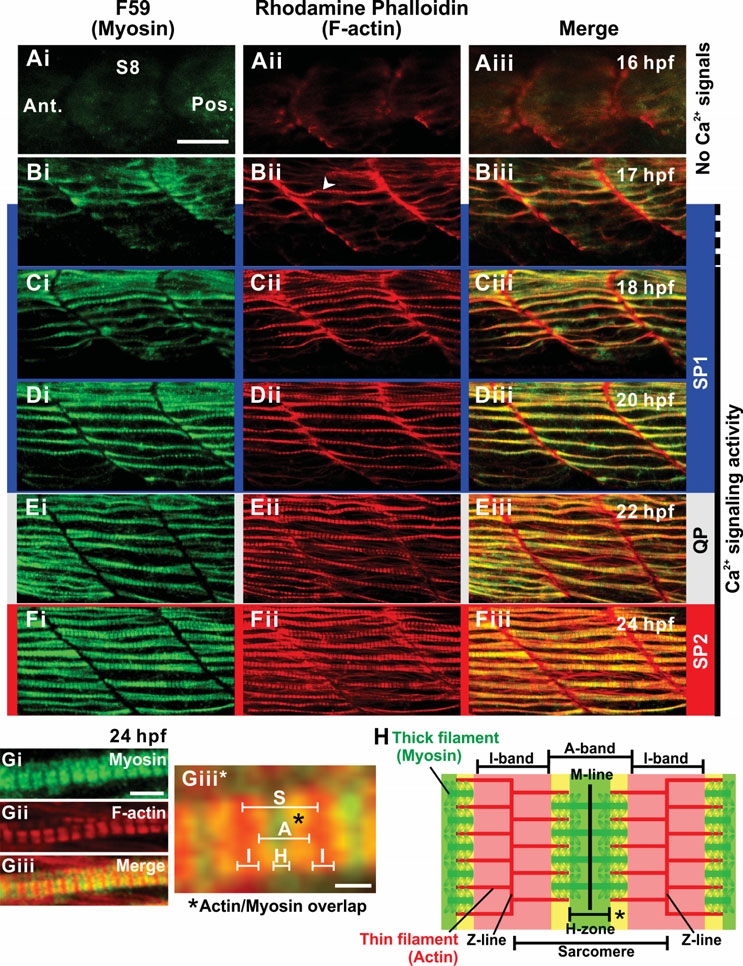
Fig. 14
Expression of myosin and actin in the trunk musculature between 16 hpf and 24 hpf. (A-F) Embryos were fixed at the times indicated in the upper right corner of each row of panels and then (Ai-Fi) the myosin was labeled via immunohistochemistry with the F59 myosin heavy chain antibody and (Aii-Fii) the F-actin was labeled with rhodamine phalloidin. (Aiii-Fiii) The merged myosin and F-actin images, with the overlapping regions shown in yellow. Ca2+ signaling periods 1 and 2 (SP1 and SP2), and the Ca2+ signaling quiet period (QP; from Fig. 3) are also shown. (Gi-Giii) Higher magnification views of (Fi-Fiii), respectively, showing the pattern of sarcomeric banding in the muscle fibers at 24 hpf. (Giii*) Higher magnification view of (Giii). S, A, H and I are sarcomere, A-band, H-zone and I-band, respectively. Scale bars are (A-F) 25 μm, (Gi-Giii) 5 μm and (Giii*) 1 μm. (H) Schematic representation of a sarcomere.