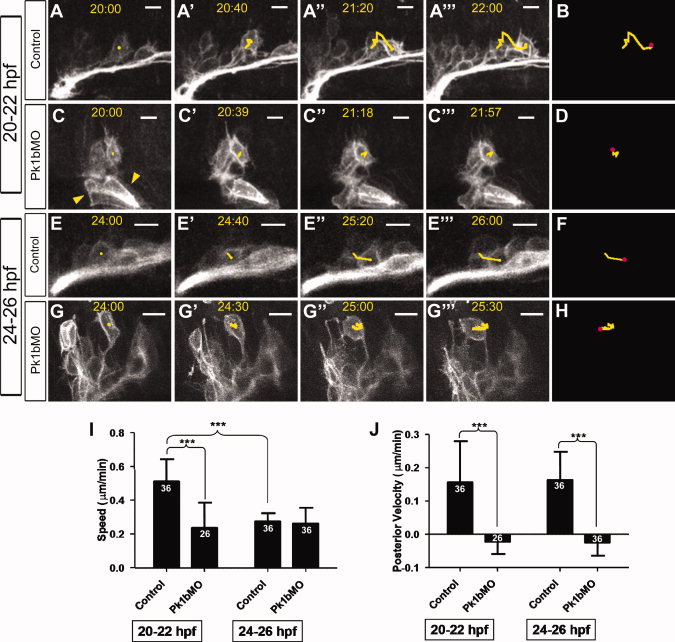
Fig. 2 Pk1b deficiency alters both overall speed and posterior-directed velocity of FBMN migration. A, C, E, G: Frames from time-lapse movies of zCREST1:membRFP embryos, showing movements of FBMNs. A-A: Control, 20-22 hpf. C-C: Pk1b morphant, 20-22 hpf. E-E: Control, 24-26 hpf. G-G: Pk1b morphant, 24-26 hpf. Scale bars = 10 m. Note that there are membRFP-positive cells in otic vesicle (yellow arrowheads). B, D, F, H: Yellow lines represent cumulative movements of cells tracked in A, C, E, and G, respectively. Pink dots correspond to final position of tracked neurons during the course of the time-lapse analysis. I,J: Average FBMN speed (I) and posterior-directed velocity (J) was measured over the course of time-lapse movies. Numbers above each bar indicate the number of cells tracked (n). N = 3 embryos for each class. Scale bars = 10 m. *P < 0.05; **P < 0.01; ***P < 0.001.
Image
Figure Caption
Figure Data
Acknowledgments
This image is the copyrighted work of the attributed author or publisher, and
ZFIN has permission only to display this image to its users.
Additional permissions should be obtained from the applicable author or publisher of the image.
Full text @ Dev. Dyn.

