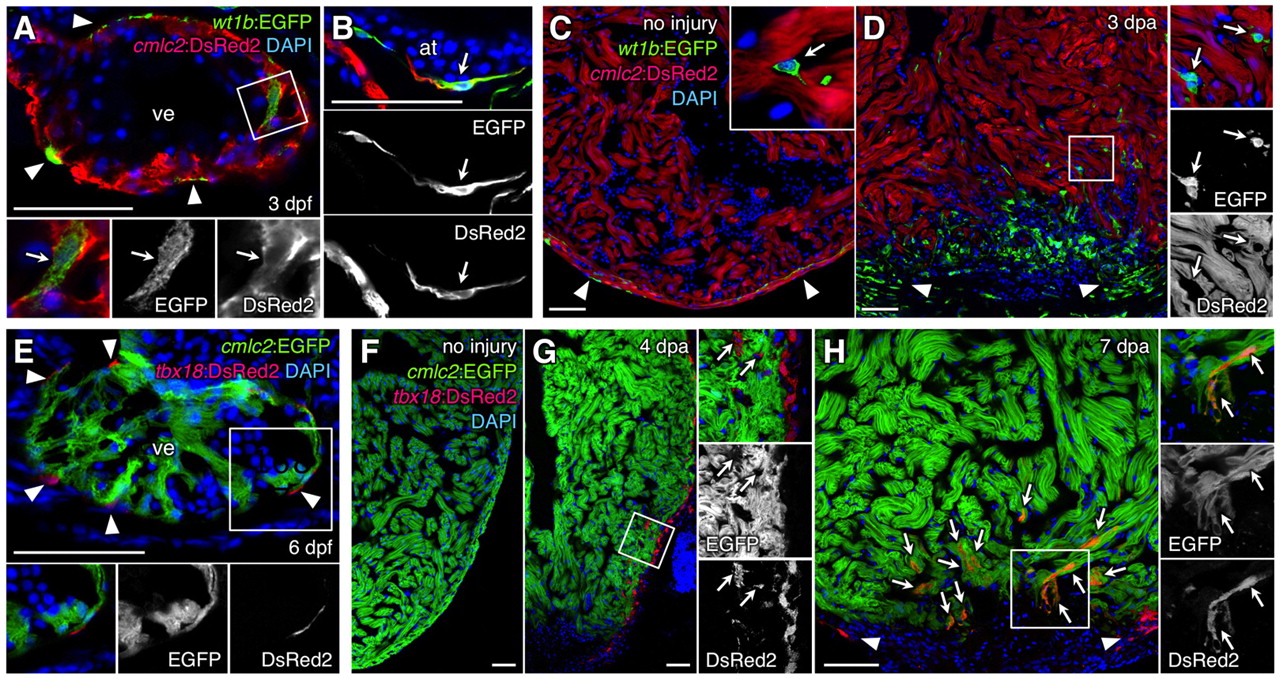
Fig. 1
Zebrafish wt1b and tbx18 regulatory sequences drive expression in epicardial and non-epicardial tissue including cardiomyocytes. (A,B) wt1b:EGFP (green) is detectable in epicardial cells (arrowheads), as well as in ventricular (A) and atrial (B) cardiac muscle (arrows), where it colocalizes with cmlc2:DsRed2 (red) at 3 days post-fertilization (dpf). (C,D) wt1b-driven EGFP marks a subset of epicardial cells (arrowheads) in the uninjured adult ventricle, as well as intra-myocardial cells (inset, arrow) that do not express cmlc2:DsRed2 (C). At 3 days post-amputation (dpa), many wt1b:EGFP+ cells lacking cmlc2:DsRed2 are evident in and around the injury site (D). A subset of these cells are epicardial (arrowheads), whereas many are intra-myocardial (arrows). Higher magnification of the boxed area is shown in each channel on the right. An antibody was used to detect EGFP in A-D. (E) tbx18:DsRed2 (red) labels epicardial cells (arrowheads) at 6 dpf, but does not colocalize with cmlc2:EGFP (green). (F,G) tbx18:DsRed2 has little or no detectable expression in the uninjured adult ventricle (F), but is detectable after injury in epicardial cells and EPDCs (G, arrows), where it does not colocalize with cmlc2:EGFP. (H) At 7 dpa, tbx18:DsRed2 colocalizes with cmlc2:EGFP in many cardiomyocytes at the injury site (arrows). Arrowheads indicate epicardial tbx18:DsRed2 fluorescence. An antibody was used to detect DsRed in E-H. at, atrium; ve, ventricle. Scale bars: 50 μm.

