Fig. S3
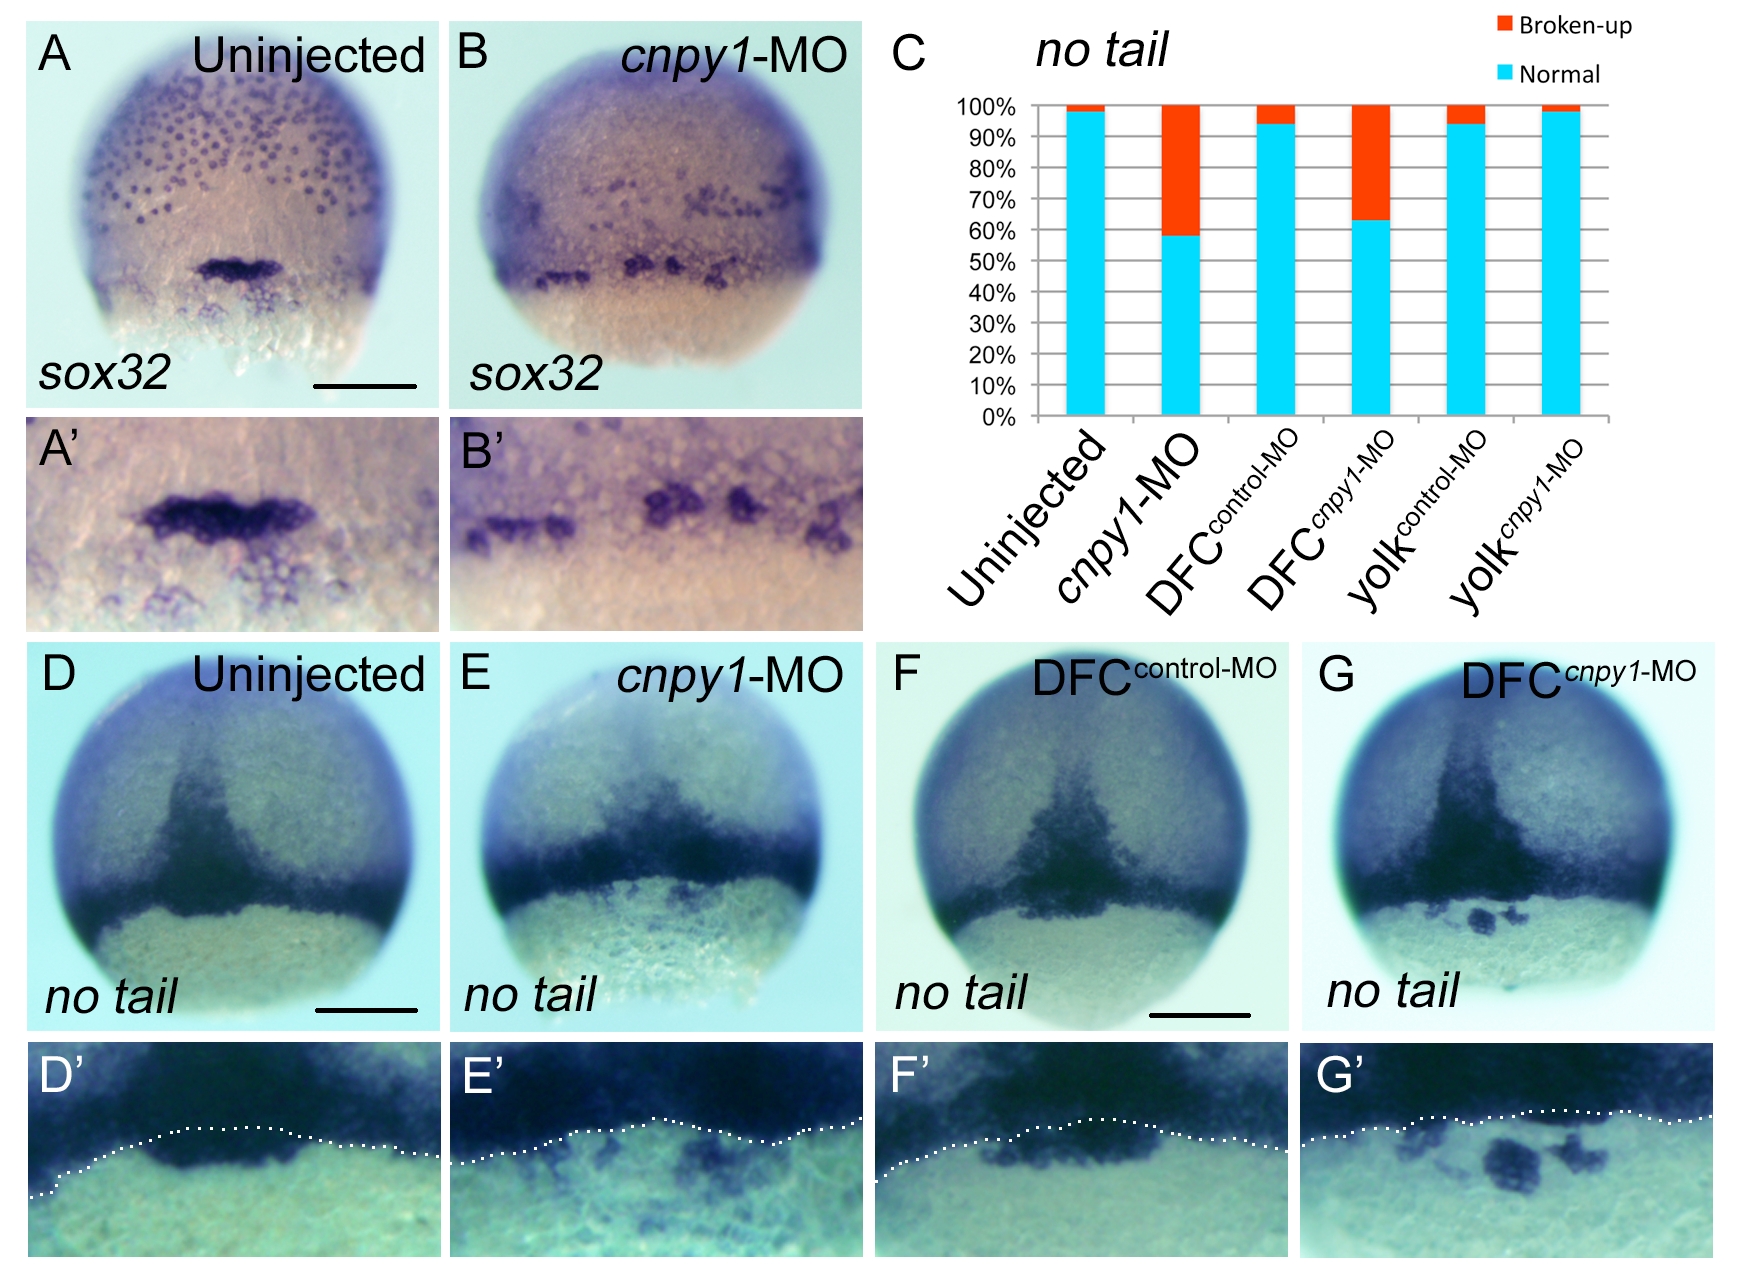
cnpy1 function is essential for DFC clustering. (A, B) sox32 expression in uninjected (A) or cnpy1-MO-injected (B) embryos. Scale bar: 200 μm. (C) Percentages of normal or broken-up DFCs were scored using the no tail expression pattern in uninjected (n = 84), cnpy1-MO (n = 55), DFCcontrol-MO (n = 64), DFCcnpy1-MO (n = 48), yolkcontrol-MO (n = 50) or yolkcnpy1-MO (n = 66) embryos. Statistically significant (P < 0.05) differences could be seen in uninjected versus cnpy1-MO (P = 2.76 x 10⁻⁹) and DFCcontrol-MO versus DFCcnpy1-MO (P = 6.1 x 10⁻⁵), while no difference was seen in uninjected versus DFCcontrol-MO (P = 0.403), uninjected versus yolkcontrol-MO (P = 0.361), DFCcontrol-MO versus yolkcontrol-MO (P = 1.000) or yolkcontrol-MO versus yolkcnpy1-MO (P = 0.314). (D-G) no tail expression in uninjected (D), cnpy1-MO-injected (E), DFCcontrol-MO (F) or DFCcnpy1-MO (G) embryos. Dorsal view, anterior to the top. Scale bar: 200 μm. (A′-D′) Higher-magnification images highlight DFCs. The white dotted lines mark the boundary between DFCs and the blastoderm margin.

