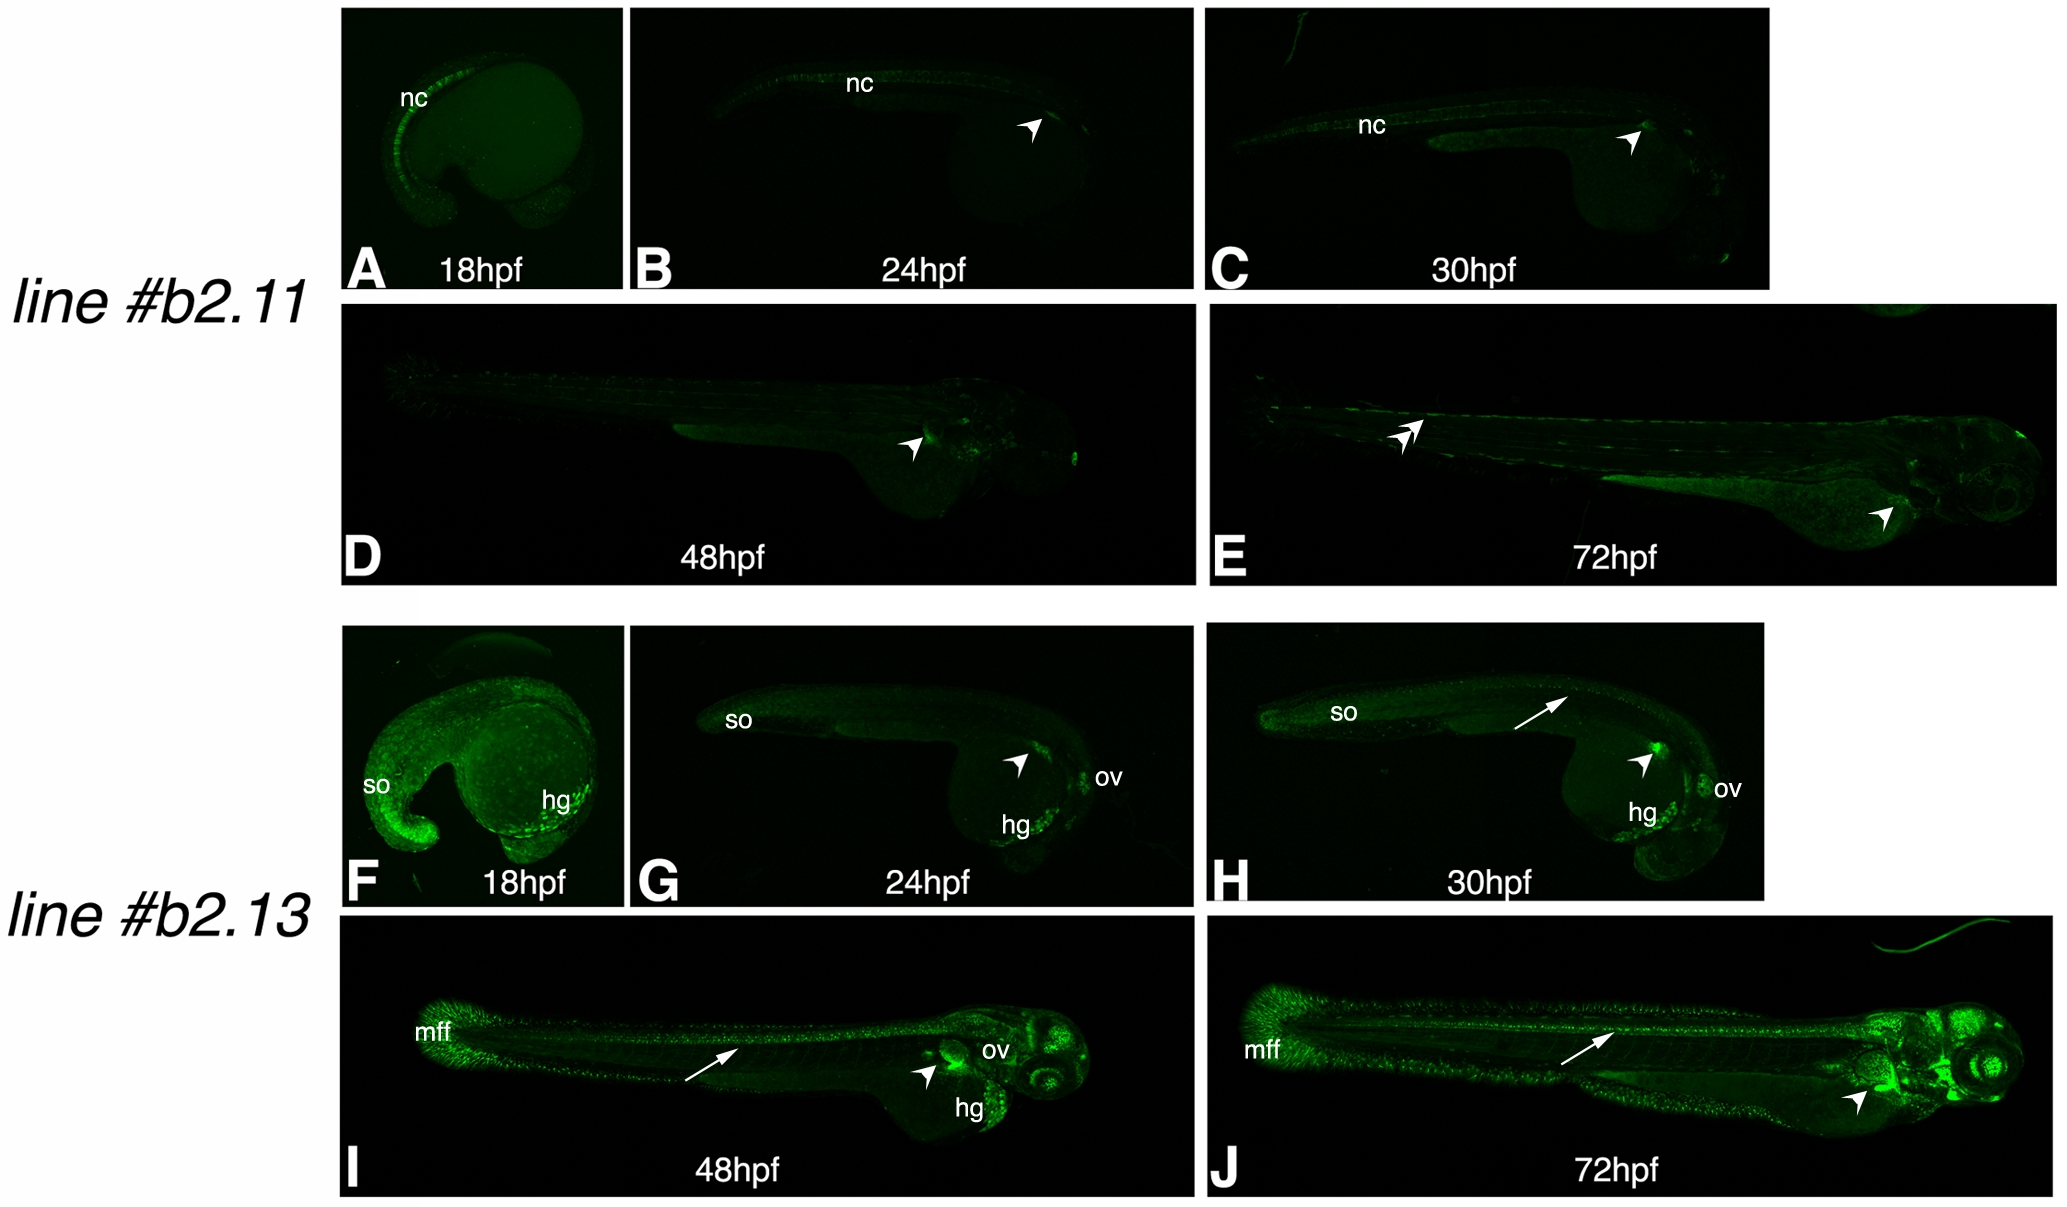
Fig. S4
Analysis of reporter gene expression in other tissues than the pectoral fins: the zfprrx1b2CNE:EGFP lines. A–E: zfprrx1b2(cFos):EGFP line#11. Apart from the expression in the developing pectoral fins from 24 hours postfertilization (hpf)onward (marked by arrowheads in B–E), detectable enhanced green fluorescent protein (EGFP) signal is observed in (i) the notochord from 18 to 30 hpf (nc, A–C) and in scattered cells surrounding the somatic muscles at 72 hpf (double arrows in E). F–J: zfprrx1b2(cFos):EGFP line#13. Apart from the expression in the developing pectoral fins from 24 hpf onward (marked here by arrowheads in G–J), EGFP signal is also observed in the following territories: (i) in the posterior-most somites from 18 to 30 hpf (so, F–H), (ii) in the hatching gland from 18 hpf onward (hg, F–I), (iii) in the otic vesicle from 24 hpf onward (ov, G–I), (iv) in the spinal cord from 30 hpf (arrows in H–J) and (v) in the anterior brain and retina as well as mesenchymal cells of the medial fin fold of the 48 and 72 hpf embryos (mff, I, J). The specific sites of reporter gene expression in the transgenic lines reported here represent positional effects due to different integration sites of the transgene. Nonspecific expression in the dorsal-most aspect of the yolk extension is also observed in these transgenic lines (A–J). All the images shown in Supp. Figs. 1S–S4 have been enhanced (as a whole) to make EGFP expression in other sites than the fins clearly observable.

